
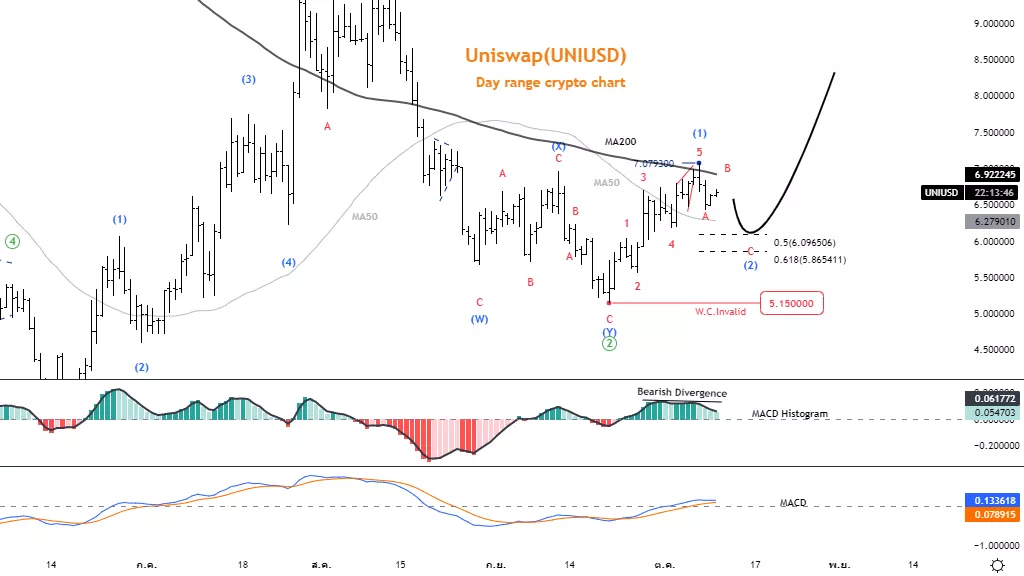
Elliott Wave Analysis TradingLounge Daily Chart, 10 October 2022,
Uniswap (UNIUSD)
UNIUSD Elliott Wave Technical Analysis
Function: Counter trend
Mode: Corrective
Structure: Zigzag
Position: Wave B
Direction Next higher Degrees: wave ((2)) of Motive
Details: Price tends to trade throwback in wave 2, before rising again, but must not below
5.150
Wave Cancel invalid Level: 5.150
Uniswap (UNIUSD) Trading Strategy: Price tested resistance at the 200 MA line, but failed to pass it tends to reverse again in the second wave before rising in the third wave. Wait for another opportunity to join the trend once the second wave is finished.
Uniswap (UNIUSD) Technical Indicators: MACD Histogram has a bearish divergence, short-term price trend a reversal.
(Click on image to enlarge)
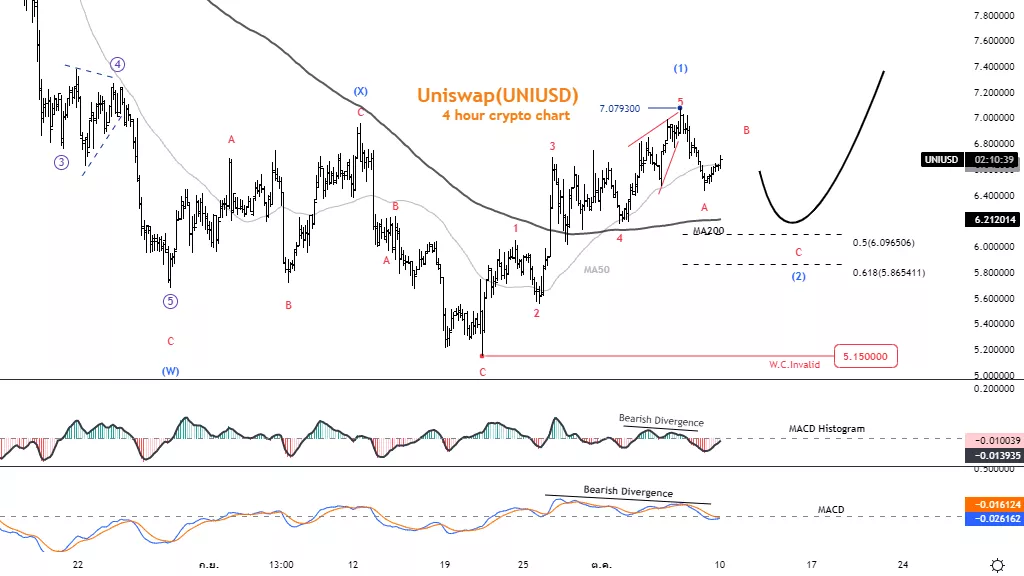
Uniswap (UNIUSD)
UNIUSD Elliott Wave Technical Analysis
Function: Counter trend
Mode: Corrective
Structure: Zigzag
Position: Wave B
Direction Next higher Degrees: wave ((2)) of Motive
Details: Price tends to trade throwback in wave 2, before rising again, but must not below 5.150
Wave Cancel invalid Level: 5.150
Uniswap (UNIUSD) Trading Strategy: Price tends to test support at the 200 MA line to reverse again in the second wave before rising in the third wave. Wait for another chance to join the trend once the second wave is finished.
Uniswap (UNIUSD) Technical Indicators: MACD and MACD Histogram has a bearish divergence, short-term price trend a reversal.
(Click on image to enlarge)


Comments
Log in or sign up to join the conversation.