

The Chicago Fed's National Activity Index, which we reported on this morning, is based on 85 economic indicators drawn from four broad categories of data:
- Production and Income
- Employment, Unemployment, and Hours
- Personal Consumption and Housing
- Sales, Orders, and Inventories
The complete list is available here in PDF format.
In this morning's Chicago Fed update, we learned that "The CFNAI Diffusion Index, which is also a three-month moving average, edged up to +0.14 in December from +0.11 in November. Forty-six of the 85 individual indicators made positive contributions to the CFNAI in December, while 39 made negative contributions. Forty indicators improved from November to December, while 44 indicators deteriorated and one was unchanged. Of the indicators that improved, ten made negative contributions".
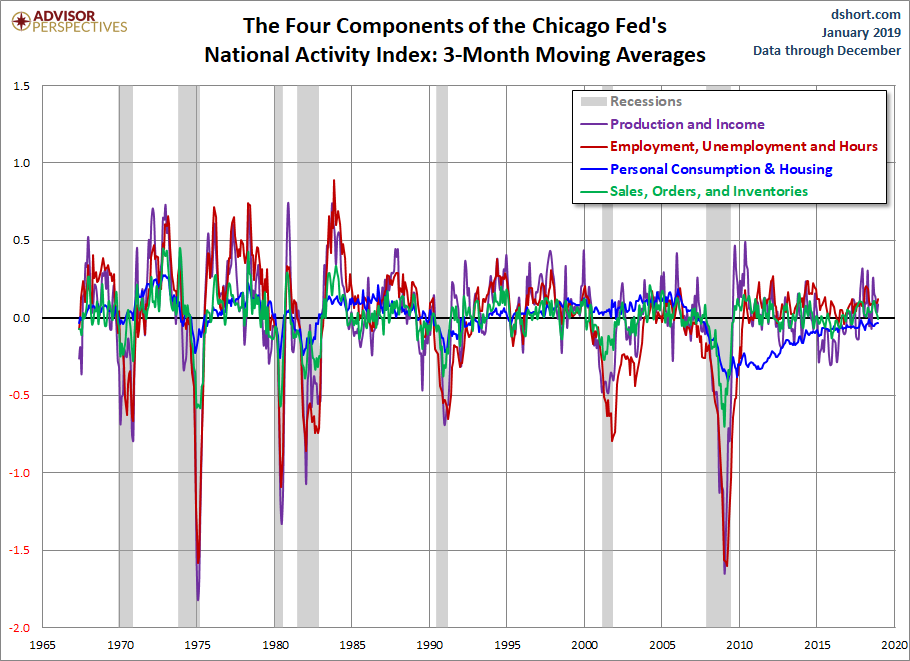
A chart overlay of the complete multi-decade span of all four categories, even if we use the three-month moving averages, is quite challenging for visual clarity:
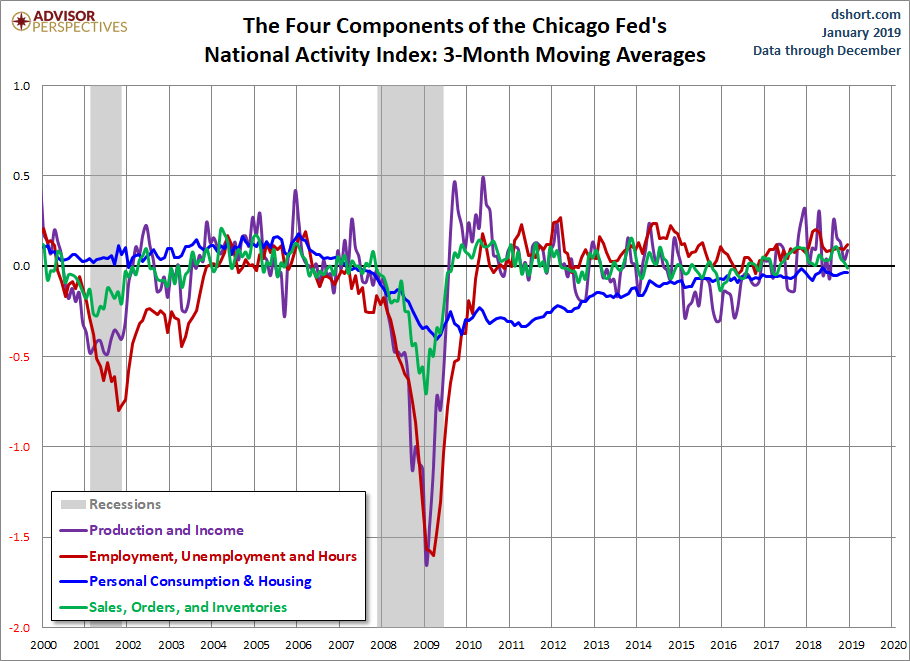
So here is a close-up view since 2000:
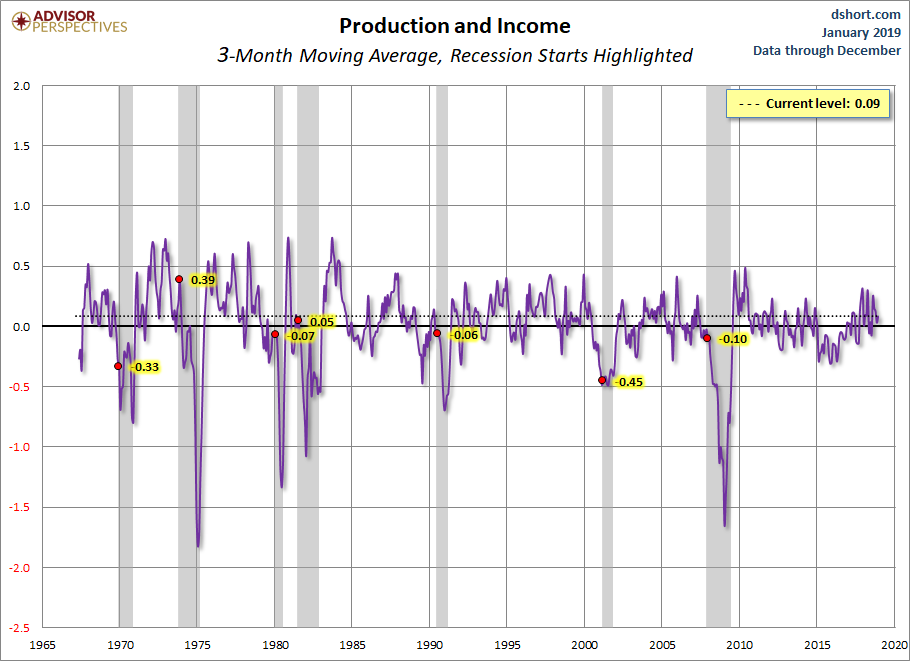
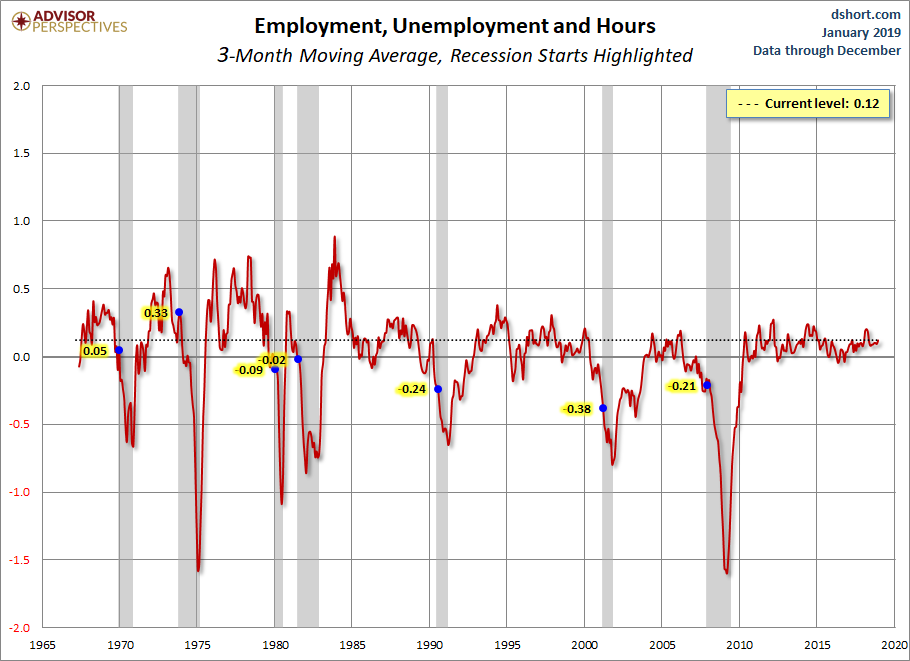
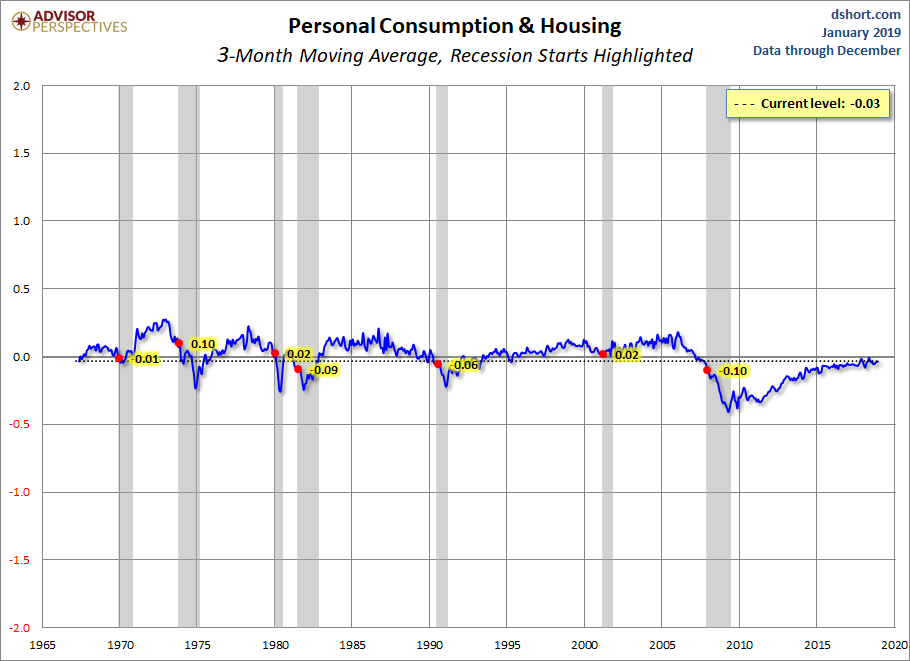
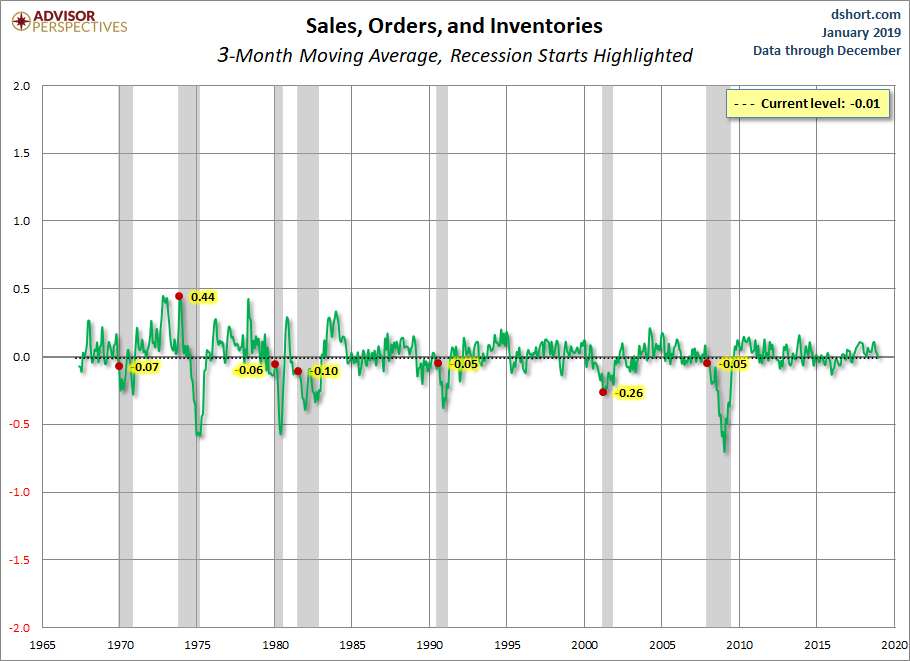
Here is a set of charts showing each of the four components since 1967. Because of the highly volatile nature of the data, the charts are based on three-month moving averages, a smoothing strategy favored by the Chicago Fed economists. The values for the months that the NBER subsequently identified as recession starts are also indicated.
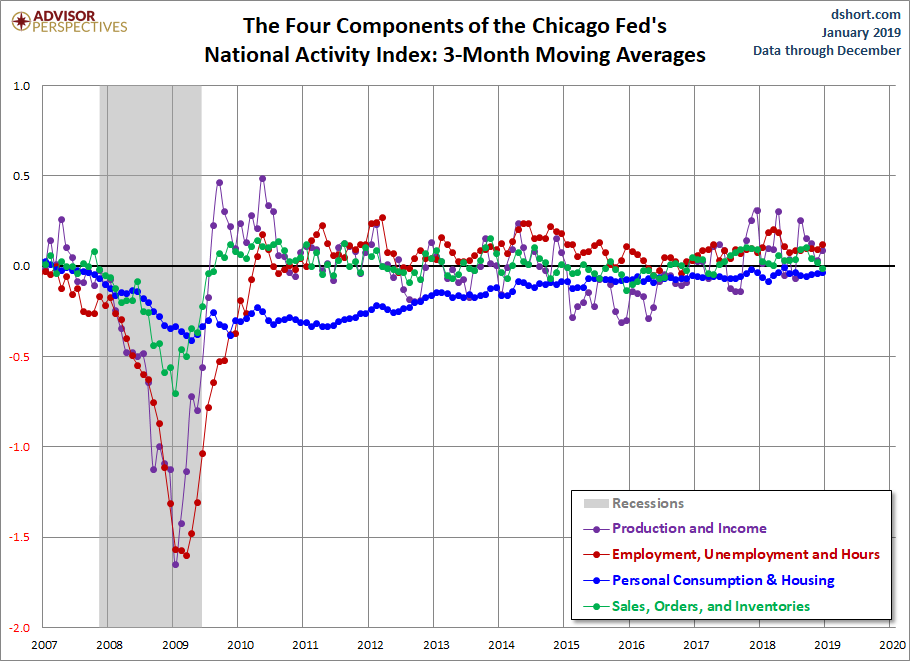
To close this dissection of the CFNAI components, let's reassemble them for a closer look at their collective 3-month moving averages since 2007.



Comments
Log in or sign up to join the conversation.