


Image Source: Unsplash
I get it. I honestly do.
When Donald Trump was inaugurated on Friday, Jan. 20, 2017, it began yet another leg of a 40-year bull market which was stopped short only by Covid-19 three full years later. For the entirety of his first term, however, the Trump market didn’t have a downtick in sight (not even during the traditionally bearish autumn season, in which it just got stronger).
Thus, it makes plenty of sense that people would think that the S&P will be at, I don't know, 8,000 points by the end of the year 2025.

Image above shows the SPY ETF from early 2017 to early 2018
May I offer, however, some important facts, as expressed by the data-based charts below. This isn’t January 2017.
I’m sure early 2017 Tim would be surprised to read these words, but in retrospect, stocks in early 2017 were cheap -- or at least reasonable.
I’ve marked, with an arrow, each of these data sets to show how much more reasonable valuations were in early 2017. These charts are from the superb site Current Market Valuation, which has data I’ve never seen anywhere else.
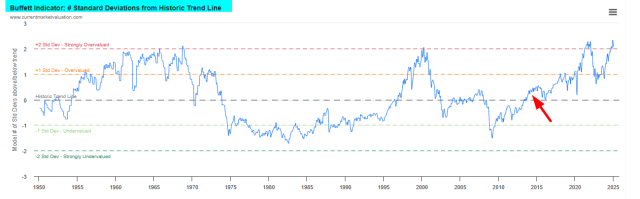
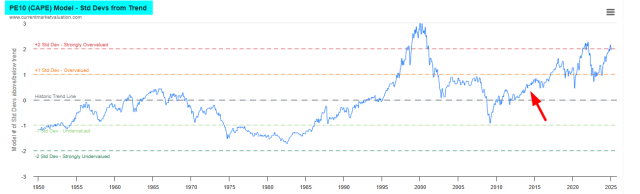
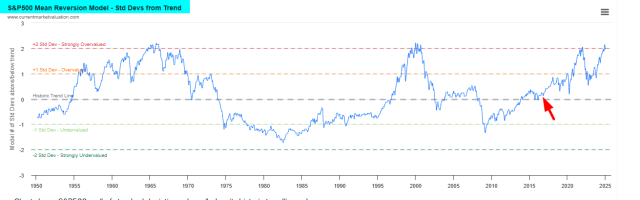
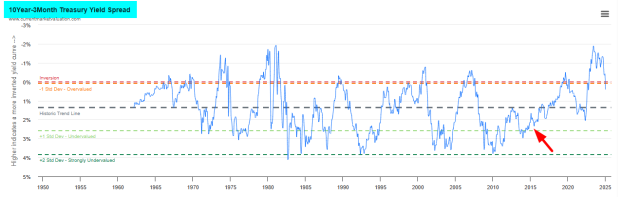
I know the expression “It’s different this time” is often held in contempt, but, honestly, look at the charts. A lot really has changed in eight years.
More By This Author:


Comments
Log in or sign up to join the conversation.