

Paul Krugman notes research out of NY Fed (analysis here) suggesting sensitivity of household inflation expectations to current actual is lower than in the past. As a reminder, here’re household expectations (Michigan, NY Fed) vs. others (economists) at the 1-year horizon.
(Click on image to enlarge)
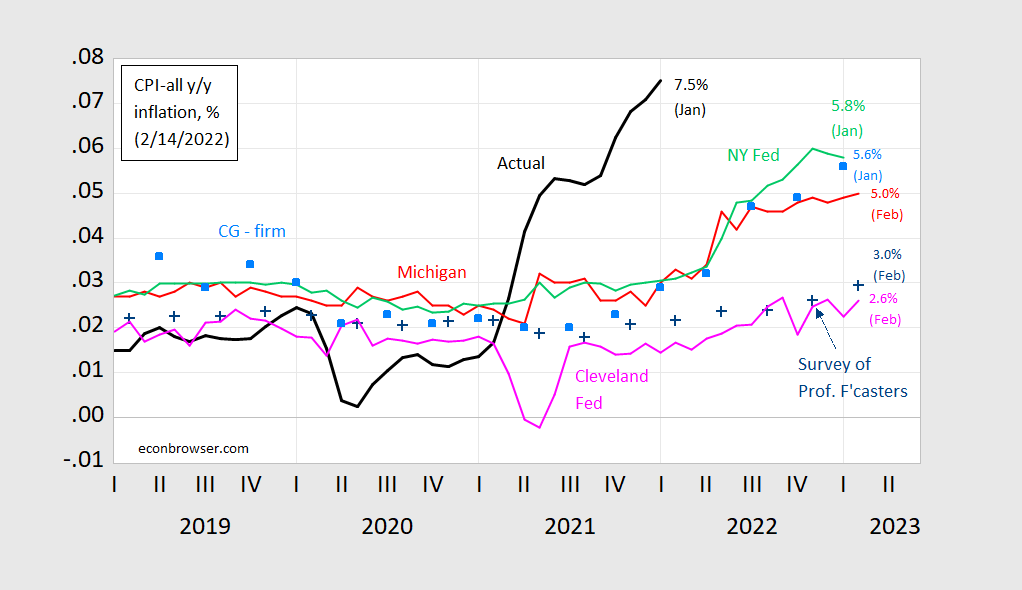
Figure 1: CPI inflation year-on-year (black), median expected from Survey of Professional Forecasters (blue +), median expected (preliminary) from Michigan Survey of Consumers (red), median from NY Fed Survey of Consumer Expectations (light green), forecast from Cleveland Fed (pink), mean from Coibion-Gorodnichenko firm expectations survey [light blue squares]. Source: BLS, University of Michigan via FRED and Investing.com, Reuters, Philadelphia Fed Survey of Professional Forecasters, NY Fed, Cleveland Fed and Coibion and Gorodnichenko.
Krugman’s main point is that the current episode drastically differs from past episodes (as measured by the MIchigan survey), in that longer term expected inflation has not moved in one-for-one tandem with short term. Rather, it’s moved less. Here’s Krugman’s graph comparing the current episode to the February 1980 and Sept 1990 episodes.
(Click on image to enlarge)
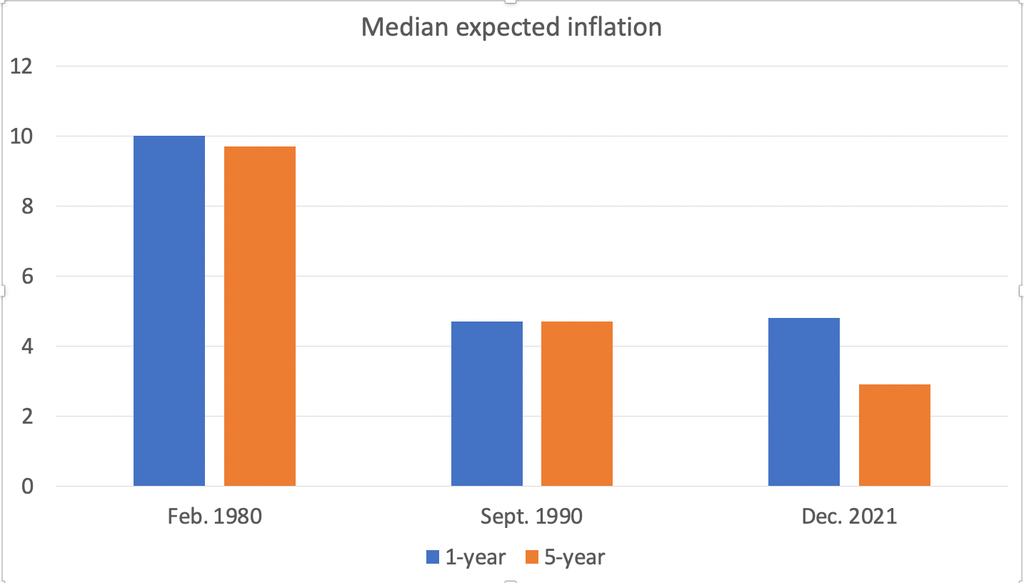
Source: Krugman (2022).
If expected inflation is 3% on average over the next 5 years, and 1 year expected inflation is 3.1%, then implied expected inflation over the years between 1 and 5 is going to average 3% (= (3×5 – 3.1)/4 ).
Note that consumer/household-based expectations have been on average higher than those from economists and other forecasters, and (as discussed here), before the ongoing inflation surge upwardly biased. Currently, household expectations are about two and a quarter percentage points higher than economists’ expectations – so don’t rely on these household forecasts for accuracy. However, they might be more relevant to thinking about how inflation responds to expectations (see Coibion and Gorodnichenko (2015).


Comments
Log in or sign up to join the conversation.