


Oil holds last week’s gains as US-Iran deadlock continues
Oil prices are holding on to last week's sharp gains as the stalemate over the Strait of Hormuz continues. President Trump has urged Americans to brace for higher fuel prices.
Brent is trading around $89 a barrel, while WTI is around $81 at the time of writing, holding on to gains of around 5% last week.
The ongoing standoff around the Strait of Hormuz means traffic through the key waterway has dropped sharply. According to Kpler, just five vessels crossed on Saturday and none on Sunday, compared with 31 the previous weekend.
Last week also saw attacks on tankers operated by Abu Dhabi and on a Saudi Aramco refinery, adding to concerns over the security of oil infrastructure in the region.
Over the weekend, Iran's Foreign Minister said Iran had decided not to resume talks with the U.S., while President Trump warned Americans that gasoline prices could rise further.
Oil prices are therefore in more of a wait-and-see mood. Any sign of renewed aggression around the Strait of Hormuz, particularly if tankers or oil infrastructure are damaged, could push prices higher.
On the other hand, any progress towards talks could ease some of the supply concerns and give oil prices room to move lower again.
Oil Forecast – Technical Analysis
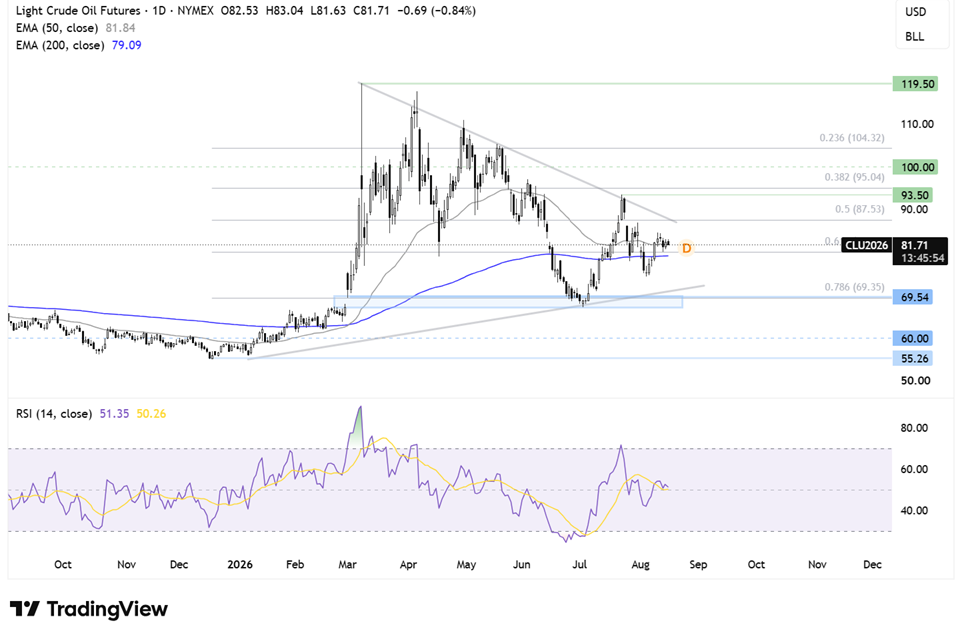
Oil is trading within a symmetrical triangle pattern. The price has pulled back from falling trend line resistance around $92 and is consolidating above the 200 EMA and around the 50 EMA. The RSI is neutral, suggesting that near-term momentum remains limited.
Buyers would need to rise above $88, the falling trend line and the 50% Fibonacci retracement of the move from the $55 low to the $120 high in order to break out of the symmetrical triangle.
A breakout would bring $95, the 38.2% Fibonacci retracement level, into focus, followed by $100.
On the downside, sellers would need to break below $80 and the 200 EMA around $79. Below here, attention turns towards the rising trend line around $70 and the $69-$70 support zone.
A break below this area could see sellers gain traction towards the $65 round-number level.
USD/JPY falls on USD weakness & despite Japanese GDP missing forecasts
USD/JPY is falling towards 159, giving back some of last week's strong gains as the yen strengthens despite weaker Japanese GDP data and the U.S. dollar comes under pressure from lower Fed rate hike expectations.
Data on Friday showed that U.S. retail sales fell 0.6% month-on-month. This came after both U.S. CPI and PPI inflation cooled in July.
As a result, the market has continued to rein in near-term Fed rate hike expectations. The market now sees a 67% probability that the Fed will leave interest rates unchanged at the September meeting, up from 45% two weeks ago.
This is weighing on the U.S. dollar across the board.
Looking ahead, attention this week will turn to the FOMC minutes on Wednesday, which could provide further insight into the debate within the Federal Reserve.
The minutes relate to the July meeting, when the Fed left rates unchanged but three policymakers dissented in favour of a rate hike.
Following the meeting and press conference, Fed Chair Walsh reiterated the Fed's goal of bringing inflation back to 2%, but gave little detail on how the central bank intends to achieve that, leaving some uncertainty around the policy outlook.
The Japanese yen is gaining despite weaker-than-expected GDP data. Q2 GDP grew just 0.3% quarter-on-quarter, with the annualised rate falling to 1.1%, below expectations of 2% and down from 2.1% in Q1.
Softer domestic demand offset strong exports.
This was the first full quarter to include the impact of the Iran war, which has brought higher energy costs for both businesses and households.
Despite the weaker GDP data, Bank of Japan rate hike expectations remain intact for now, although the figures do complicate the outlook. A rate hike as early as September remains a possibility.
However, the central bank may move more gradually if household spending remains under pressure.
USD/JPY Forecast – Technical Analysis
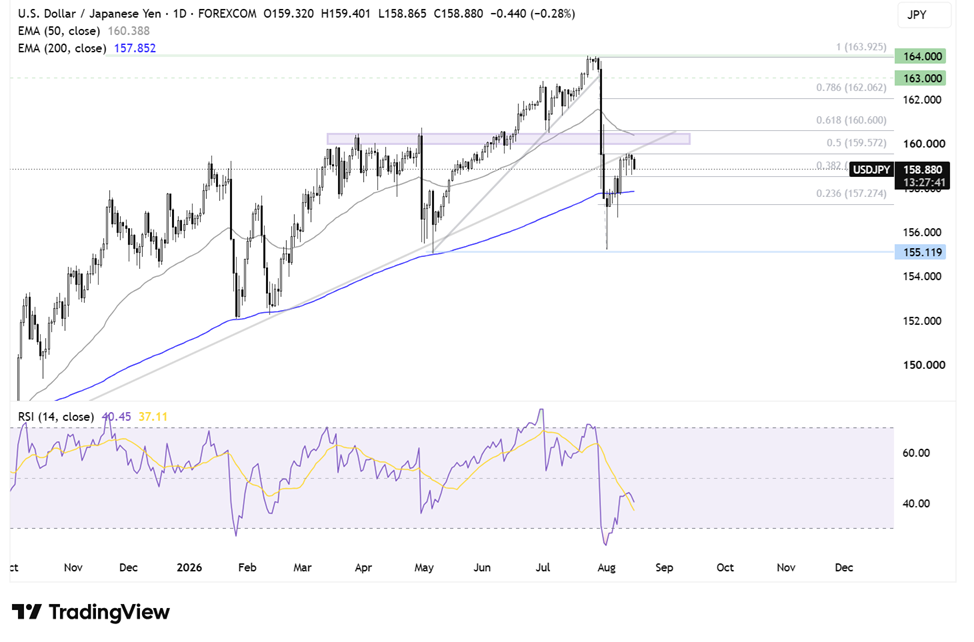
USD/JPY's recovery from the 155.20 low has run into resistance around 158.50, where the rising multi-month trend line and the 50% Fibonacci retracement of the move from 164 to 155.20 converge.
The RSI is below 50, keeping sellers hopeful of further downside.
Sellers need to break below 158.50, the 38.2% Fibonacci retracement level, to expose the 200 EMA around 158. Below here, attention turns towards 157.25, the 23.6% Fibonacci level.
A break below 157.25 could see sellers gain traction towards 155.20.
On the upside, buyers would need to break above 160, where the 50 EMA and 61.8% Fibonacci retracement level provide resistance.
A sustained move above 160 would make the outlook more constructive and bring 162 and 163 into focus, ahead of 164, the 2026 high.



Comments
Log in or sign up to join the conversation.