


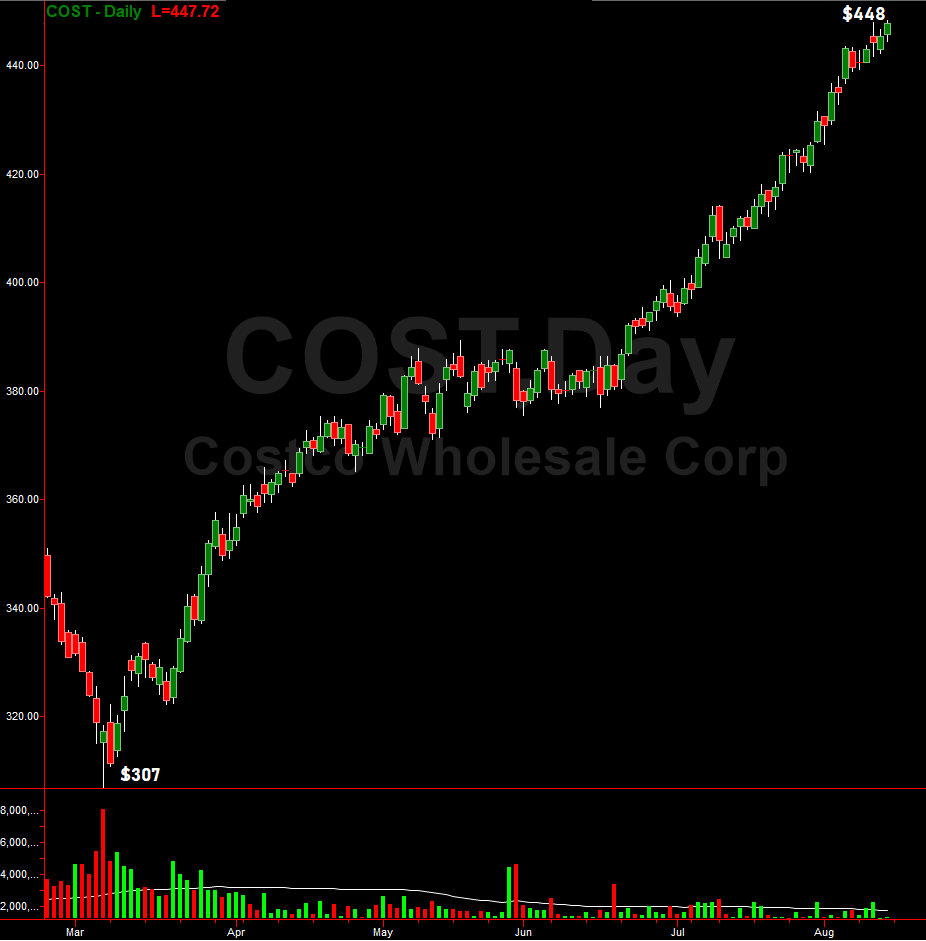
COST has an RSI of over 84 and has been above 70 for nearly 6 weeks… may be putting in a top today. Possible Topping Tail on the daily chart. In terms of a correction, a pull back to $390 is likely over the next few months. Note the chart below…
(Click on image to enlarge)
Untriggered head and shoulder pattern on XOM could tell of further downside in oil. If it triggers, Exxon has downside to $45.00. Note the chart...




Comments
Log in or sign up to join the conversation.