
There is much waiting going on; will Macron's talks with Putin move the needle, will Olaf Scholz speak in a firmer tone about the Ukraine, what will Thursday's US CPI data hold?

These and other questions economic and political caused the stock market to take a pause or yawn, depending how you look at it, yesterday. At the close of Monday trading the S&P 500 was down 7 points, to close at 4,484, the Dow Jones Average was up 1 point, to close at 35,091 and the Nasdaq Composite was down 82 points, to close at 14,016. In early morning action S&P futures are trading up 1 point, Dow futures are trading up 25 points and Nasdaq 100 futures are trading up 0.5 points. Waiting is of course not without anxiety and one reflection of that was another 5% drop in Meta's (FB) stock price as they ready to spar with European regulators. The 5 day chart for Meta looks particularly brutal and no doubt cause for ripples in many ETFs across the spectrum.
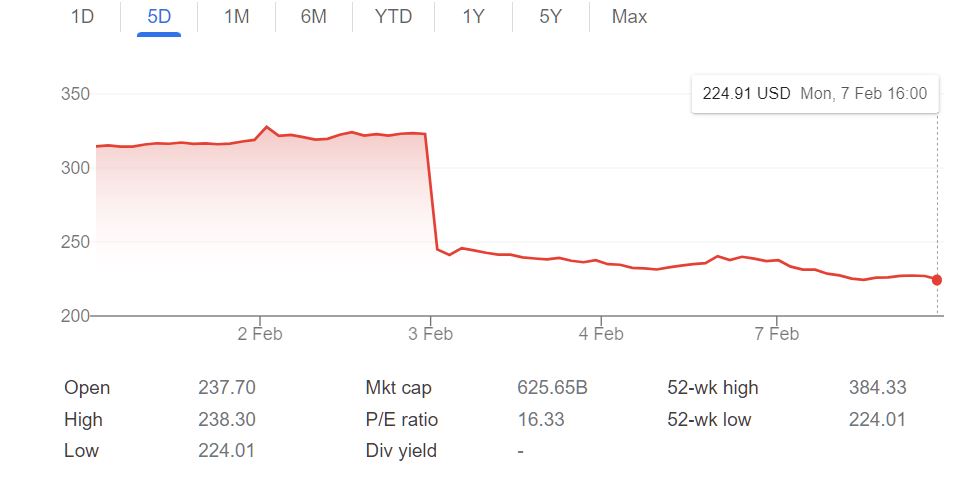
Google: Meta 5 Day Chart
In a TalkMarkets Editor's choice article, Sheraz Mian reports that Tech Earnings Impress In The Face Of Economic Headwinds.
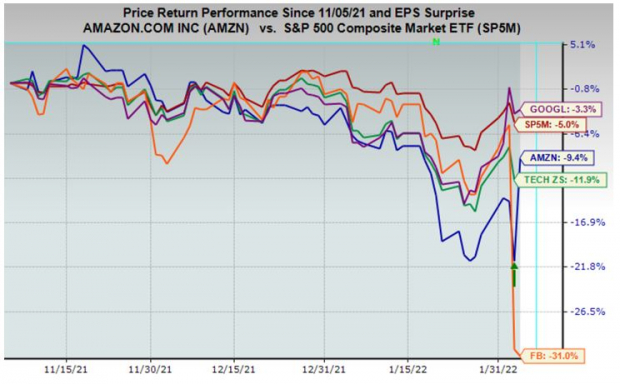
Image Source: Zacks Investment Research
"It has been fascinating to see the extent to which the 5 largest Tech stocks – Amazon (AMZN), Alphabet (GOOGL), Apple (AAPL), Meta (FB) ) and Microsoft (MSFT) – have moved in response to their quarterly releases in recent days. While Alphabet and Amazon literally added hundreds of billions of dollars to their market capitalizations in the following day’s trading session, Facebook lost that much after disappointing investors.
These stocks have practically behaved like coiled springs, with the earnings reports helping release them. You can see this in the chart below that shows the stock market performance over the last 3 months of the Zacks Technology sector (green line), the S&P 500 index (red line), Alphabet (purple line), Amazon (blue line), and Facebook (orange line).
These 5 companies are enormously important to the market as a whole, both in terms of their weight in the indexes as well as their earnings contribution. They combined account for 22.5% of the S&P 500 index’s market capitalization and are contributing 20% of the index’s total 2021 Q4 earnings. For the quarter, these 5 large companies combined earned $98.6 billion in earnings on $408.6 billion in revenues, representing year-over-year growth rates of +26.7% and +15.3%, respectively.
Take a look at the chart below that shows current consensus expectations for this group for the coming periods in the context of what they were able to achieve in 2021 Q4 and the preceding period."
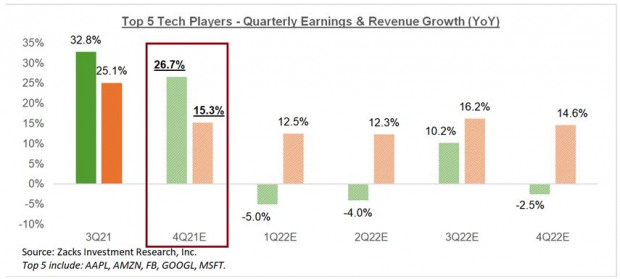
Image Source: Zacks Investment Research
The charts speak for themselves, but see Mian's full article for additional insights.
Continuing in a similar vein contributor Tajinder Dhillon has A Look At ‘FAANMG’ Stocks Vs. S&P 500: Margins, Valuation, Earnings.
"The FAANMG Index currently makes up 23.8% of the entire S&P 500 index on a market cap basis and 21.6% for the Russell 1000 index...(In this note, we look at) the ‘FAANMG’ basket of companies that are classified as high growth technology companies which will be of interest given the macro-outlook of higher inflation and higher interest rates. FAANMG consists of Meta Platforms Inc, Apple Inc, Amazon.com Inc, Netflix Inc (NFLX), Microsoft Corp, and Alphabet Inc...
At a company level, three out of the six constituents in the basket are trading below historical 10-year averages. Netflix Inc is the cheapest out of the group as it currently has a forward 12-month P/E of 36.5x vs. a 10-year average of 118.9x, marking a 69% discount. Amazon Inc is second cheapest with a forward P/E of 60.5x (51% discount vs. 10-year average), while Meta Platforms Inc trades at a 41% discount to its long-term average (18.2x vs. 30.6x).
While the focus will be on higher interest rates, macro headwinds, and supply chain disruptions, FAANMG stocks continue to deliver robust top-line growth and strong margins. Exhibit 3 shows how strong EBITDA margins are for the FAANMG index, which currently reads 33.0%, dwarfing the average EBITDA margin of 20.3% for the S&P 500 and 12.4% for the Russell 2000 Index.
Exhibit 3: Forward 12-month EBITDA Margin

How do earnings look for FAANMG?
As we are approximately halfway through the U.S. earnings season, we analyze earnings and revenue growth for the FAANMG index using data from our S&P 500 Earnings Scorecard as shown in Exhibit 4.
21Q4 blended earnings growth for the S&P 500 index is currently forecasted at 30.0% with 281 companies who have reported results. Our growth rate is a blend of actuals and estimates for yet-to-report constituents. When looking at FAANMG constituents, we arrive at an aggregate blended earnings growth rate of 28.9%.
2022 looks to be a tough year for FAANMG from an earnings growth perspective, mainly due to difficult year-over-year comparisons. It is currently expected to deliver weaker earnings growth compared to the S&P 500 in three of the four quarters (22Q1, 22Q2, and 22Q4). Looking at FY2022 growth rates, S&P 500 is expected to deliver earnings growth of 7.7% compared to 1.2% for FAANMG on an aggregated basis."
Exhibit 4: Earnings Growth for FAANMG and S&P 500

This is a well researched piece. See the full article for a look at additional parameters, though the 2022 bars in the chart above tell quite a story on their own.
Contributor Thomas Westwater takes a stab at what investors can expect in Tuesday trading in his article Bitcoin Flags Risk-On Sentiment Into Asia-Pacific Trading After Nasdaq Falls.

"Bitcoin broke higher overnight, adding to upside stemming from the late-January multi-month swing low, and bringing prices above the 50-day Simple Moving Average (SMA). The 61.8% and 78.6% Fibonacci retracements may offer some resistance, with a break above those levels exposing the 200-day SMA. Alternatively, a move back to the downside would see bulls likely attempt to defend the psychological 40,000 level. MACD is aiming for a break above its center line, a bullish sign, while the RSI oscillator is also aimed firmly higher."
Bitcoin Daily Chart
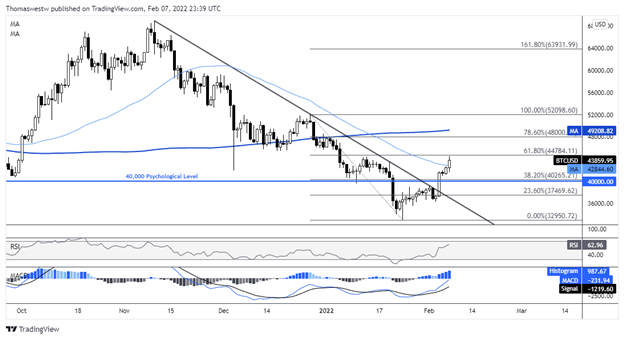
Chart created with TradingView
TalkMarkets contributor Ironman provides final December 2021 new home sales data and finds that the U.S. New Home Market Continues Shrinking.
"The U.S. new home market continued shrinking in December 2021. Political Calculations' initial estimate of the overall market capitalization of the U.S. new home market for December 2021 is $26.14 billion. That figure is 13.2% below the December 2020 peak of $30.12 billion."
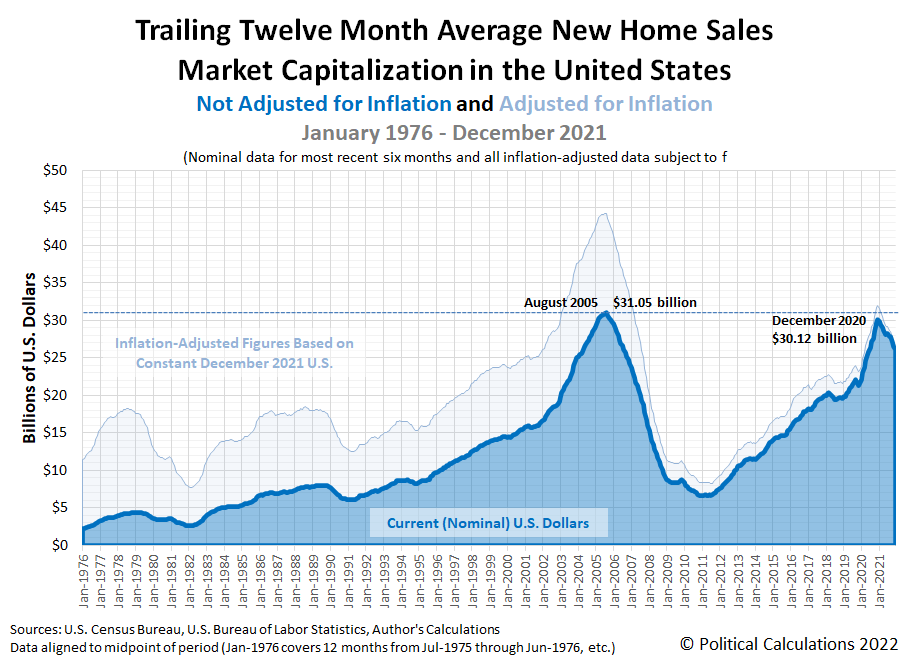
"For December 2021, there were two notable developments. First, the number of new home sales rose slightly from the previous month, breaking what had been a steady decline. Second, the average sale price of the new homes sold declined, confirming the reversal of what had been a rising trend in recent months."
See Ironman's article for additional charts.
In another TalkMarkets Editor's Choice piece, contributor Marc Chandler writes that the markets are Looking For Clarity While Waiting For Godot.
In a detailed article about what we might expect in FX markets going forward, Chandler begins his column with a look at what has transpired in 2022 thus far.
"In the first few weeks of the year, there have been several breakouts in the foreign exchange market that have not been sustained. The dollar broke higher to start the year against the Japanese yen, rising to five-year highs, only to reverse and return to the JPY112.50-JPY115.50 range that confined it more or less since the middle of last October.
The euro was bid to around $1.1485 in mid-January, its best level in two months. It quickly reversed and fell to its lowest level since mid-2020 (~$1.1120). It returned to the previous $1.12-$1.14 range, but jumped back above it with the help of the ECB's hawkish signals. The January high proved a sufficient cap with the help of the unexpectedly strong US jobs report.
With geopolitical tensions running high in Europe, the Swiss franc rose to seven-year highs against the euro, but it also bounced back to return to the status ante. Indeed, in the second half of last week, the euro traded above CHF1.06, its highest level since last November.
The dollar spiked higher against the Russian ruble, poking above RUB80 for the first time since late 2020. It did not manage to close above this key area, and even without a resolution of the tensions, the dollar pulled back to test a trendline drawn off the October and December lows, coming in below RUB76.
Despite the divergence in policy and official cautionary remarks, the market sold the dollar to its lowest level against the Chinese yuan since April 2018 (~CNY6.32) before recovering back into the CNY6.35-CNY6.40 range that had dominated activity since the middle of last October before the Lunar New Year.
The Australian dollar was sold below $0.7000 for the first time since July 2020. At the end of January, it touched three standard deviations below the 20-day moving average. The proverbial rubber band has not stretched that far since last August, when the Aussie launched a two-and-a-half-week rally that lifted it from around $0.7100 to about $0.7480.
This time too, the Australian dollar recovered to test the $0.7200 area. In fact, it made new highs after the central bank continued to push back against market pressures for a hike, which remained fully priced in for July.
The New Zealand dollar has been an exception to the false breakout pattern seen over the past few weeks. The Kiwi had found support near $0.6700, but punched through it in late January, falling to $0.6530, its lowest level since September 2020. It stabilized but it turned back after approaching the $0.6700 area ahead of the weekend.
The price action warns of a retest on last month's low near $0.6530. The swaps market has about 190 bps of tightening priced in for the Reserve Bank of New Zealand over the next 12 months. This is more aggressive than any other high-income country.
Among the G7, the Bank of Canada is seen as the most hawkish and the market has priced in nearly 165 bps of tightening over the next 12 months. The swaps market sees about 125-135 bps of tightening from the Federal Reserve and the Bank of England."

"Estragon: I can't go on like this.
Vladimir: That's what you think."
That's a wrap for this Tuesday, morning. Have a good one and get vaccinated (if you need to).
I'll see you on Thursday.


Comments
Log in or sign up to join the conversation.