

Headline data for truck shipments show improved growth in October.

Analyst Opinion of Truck Transport
I tend to put heavier weight on the CASS index which showed slower growth year-over-year. The ATA data showed a similar trend but their overall trend line seems wrong.
It should be pointed out that although the data seems to be improving, it is nothing to write home about.
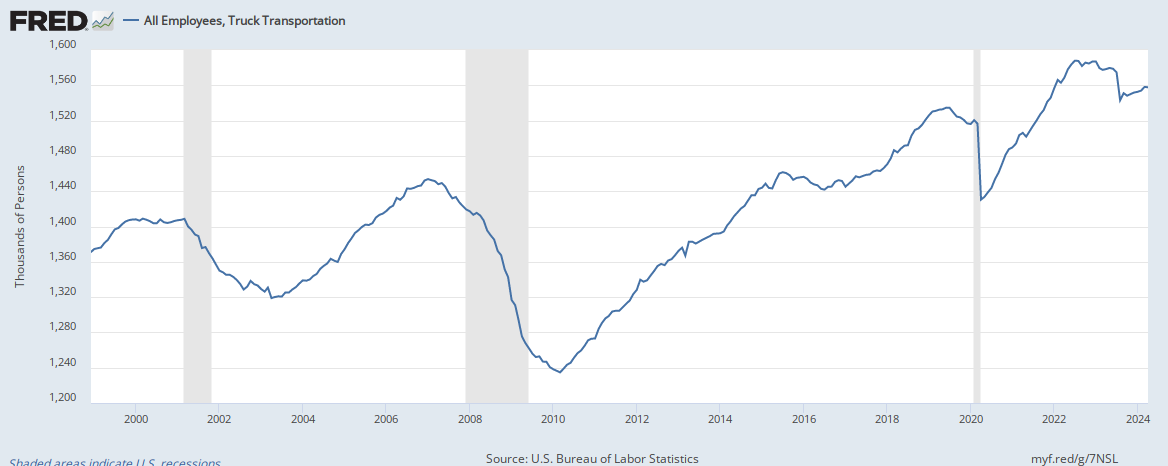
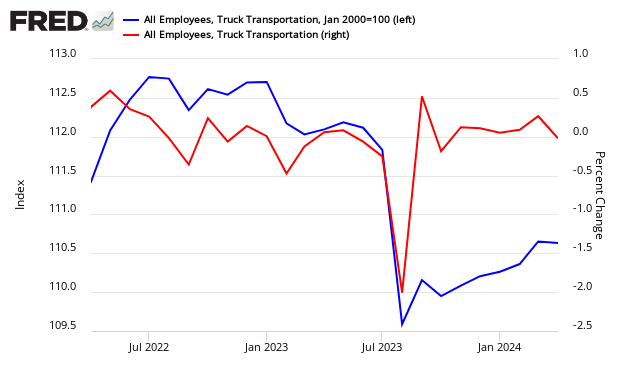
It is also interesting that the current trucking employment pattern shows little growth over the last few years.
(Click on image to enlarge)
ATA Trucking
American Trucking Associations' advanced seasonally adjusted (SA) For-Hire Truck Tonnage Index grew 3.3 % in October, following a 1.9 % decline in September. In October, the index equaled 147.6 (2000=100), up from 142.9 in September. Said ATA Chief Economist Bob Costello:
Continued improvement in truck tonnage reflects a much stronger freight market. This strength is the result of several factors, including consumption, factory output, construction and improved inventory levels throughout the supply chain. Additionally, the 6.7% rise in tonnage over the last four months suggests to me that retailers are expecting a good holiday spending season.
ATA Truck tonnage this month
(Click on image to enlarge)

z truck.jpg
Compared with October 2016, the SA index surged 9.9%, which was the largest year-over-year increase since December 2013. In September, the index increased 6.3% on a year-over-year basis. Year-to-date, compared with the same ten months in 2016, the index is up 3.1%.
Econintersect tries to validate ATA truck data across data sources. It appears this month that jobs growth says the trucking industry employment levels were little changed month-over-month. Please note using BLS employment data in real time is risky, as their data is normally backward adjusted (sometimes significantly).
(Click on image to enlarge)
This data series is not transparent and therefore cannot be relied on. Please note that the ATA does not release an unadjusted data series (although they report the unadjusted value each month - but do not report revisions to this data) where Econintersect can make an independent evaluation. The data is apparently subject to significant backward revision. Not all trucking companies are members of the ATA, and therefore it is unknown if this data is a representative sampling of the trucking industry.
source: ATA
CASS FREIGHT INDEX REPORT
Volume Continues to be Strong, Prices Continue to Rise
Both the Cass Shipments and Expenditures Indexes extended their run of positive year‐over‐year
comparisons. Shipment volume turned positive eleven months ago, while Expenditures turned positive ten
months ago. Throughout the U.S. economy, we are continuing to see a growing number of data points
suggesting that the economy continues to get incrementally better. The 2.9% year‐over‐year increase in the
October Cass Shipments Index is yet another data point which confirms that the first positive indication in
last October (before the election) was a change in trend. In fact, it now looks as if the October 2016 Cass
Shipments Index, which broke a string of 20 months in negative territory, was one of the first indications that a
recovery in freight had begun.[shipments up 0.5% month-over-month and up 2.9% year-over-year]
(Click on image to enlarge)

z truck1.PNG


Comments
Log in or sign up to join the conversation.