

Let's take a closer look at recent activity in US Treasuries. The yield on the 10-year note ended August 15, 2019, at 1.59%, the yield on the 2-year note is 1.58% and the 30-year mortgage rate is at 3.60%.
(Click on image to enlarge)
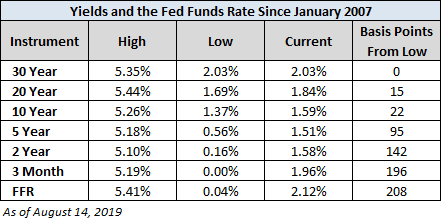
Here is a table showing the yields highs and lows and the FFR since 2007 as of the July 12th close.
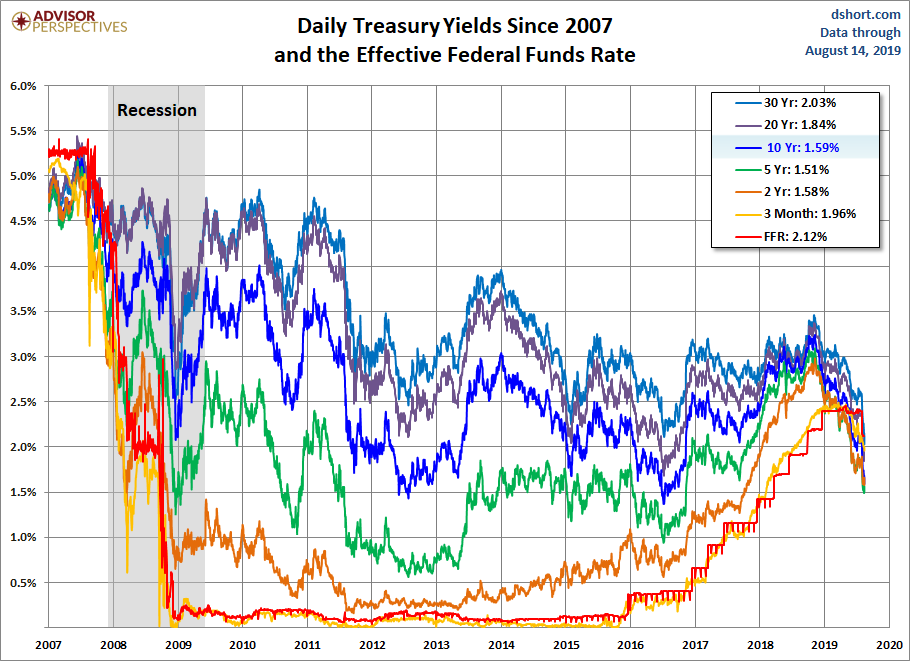
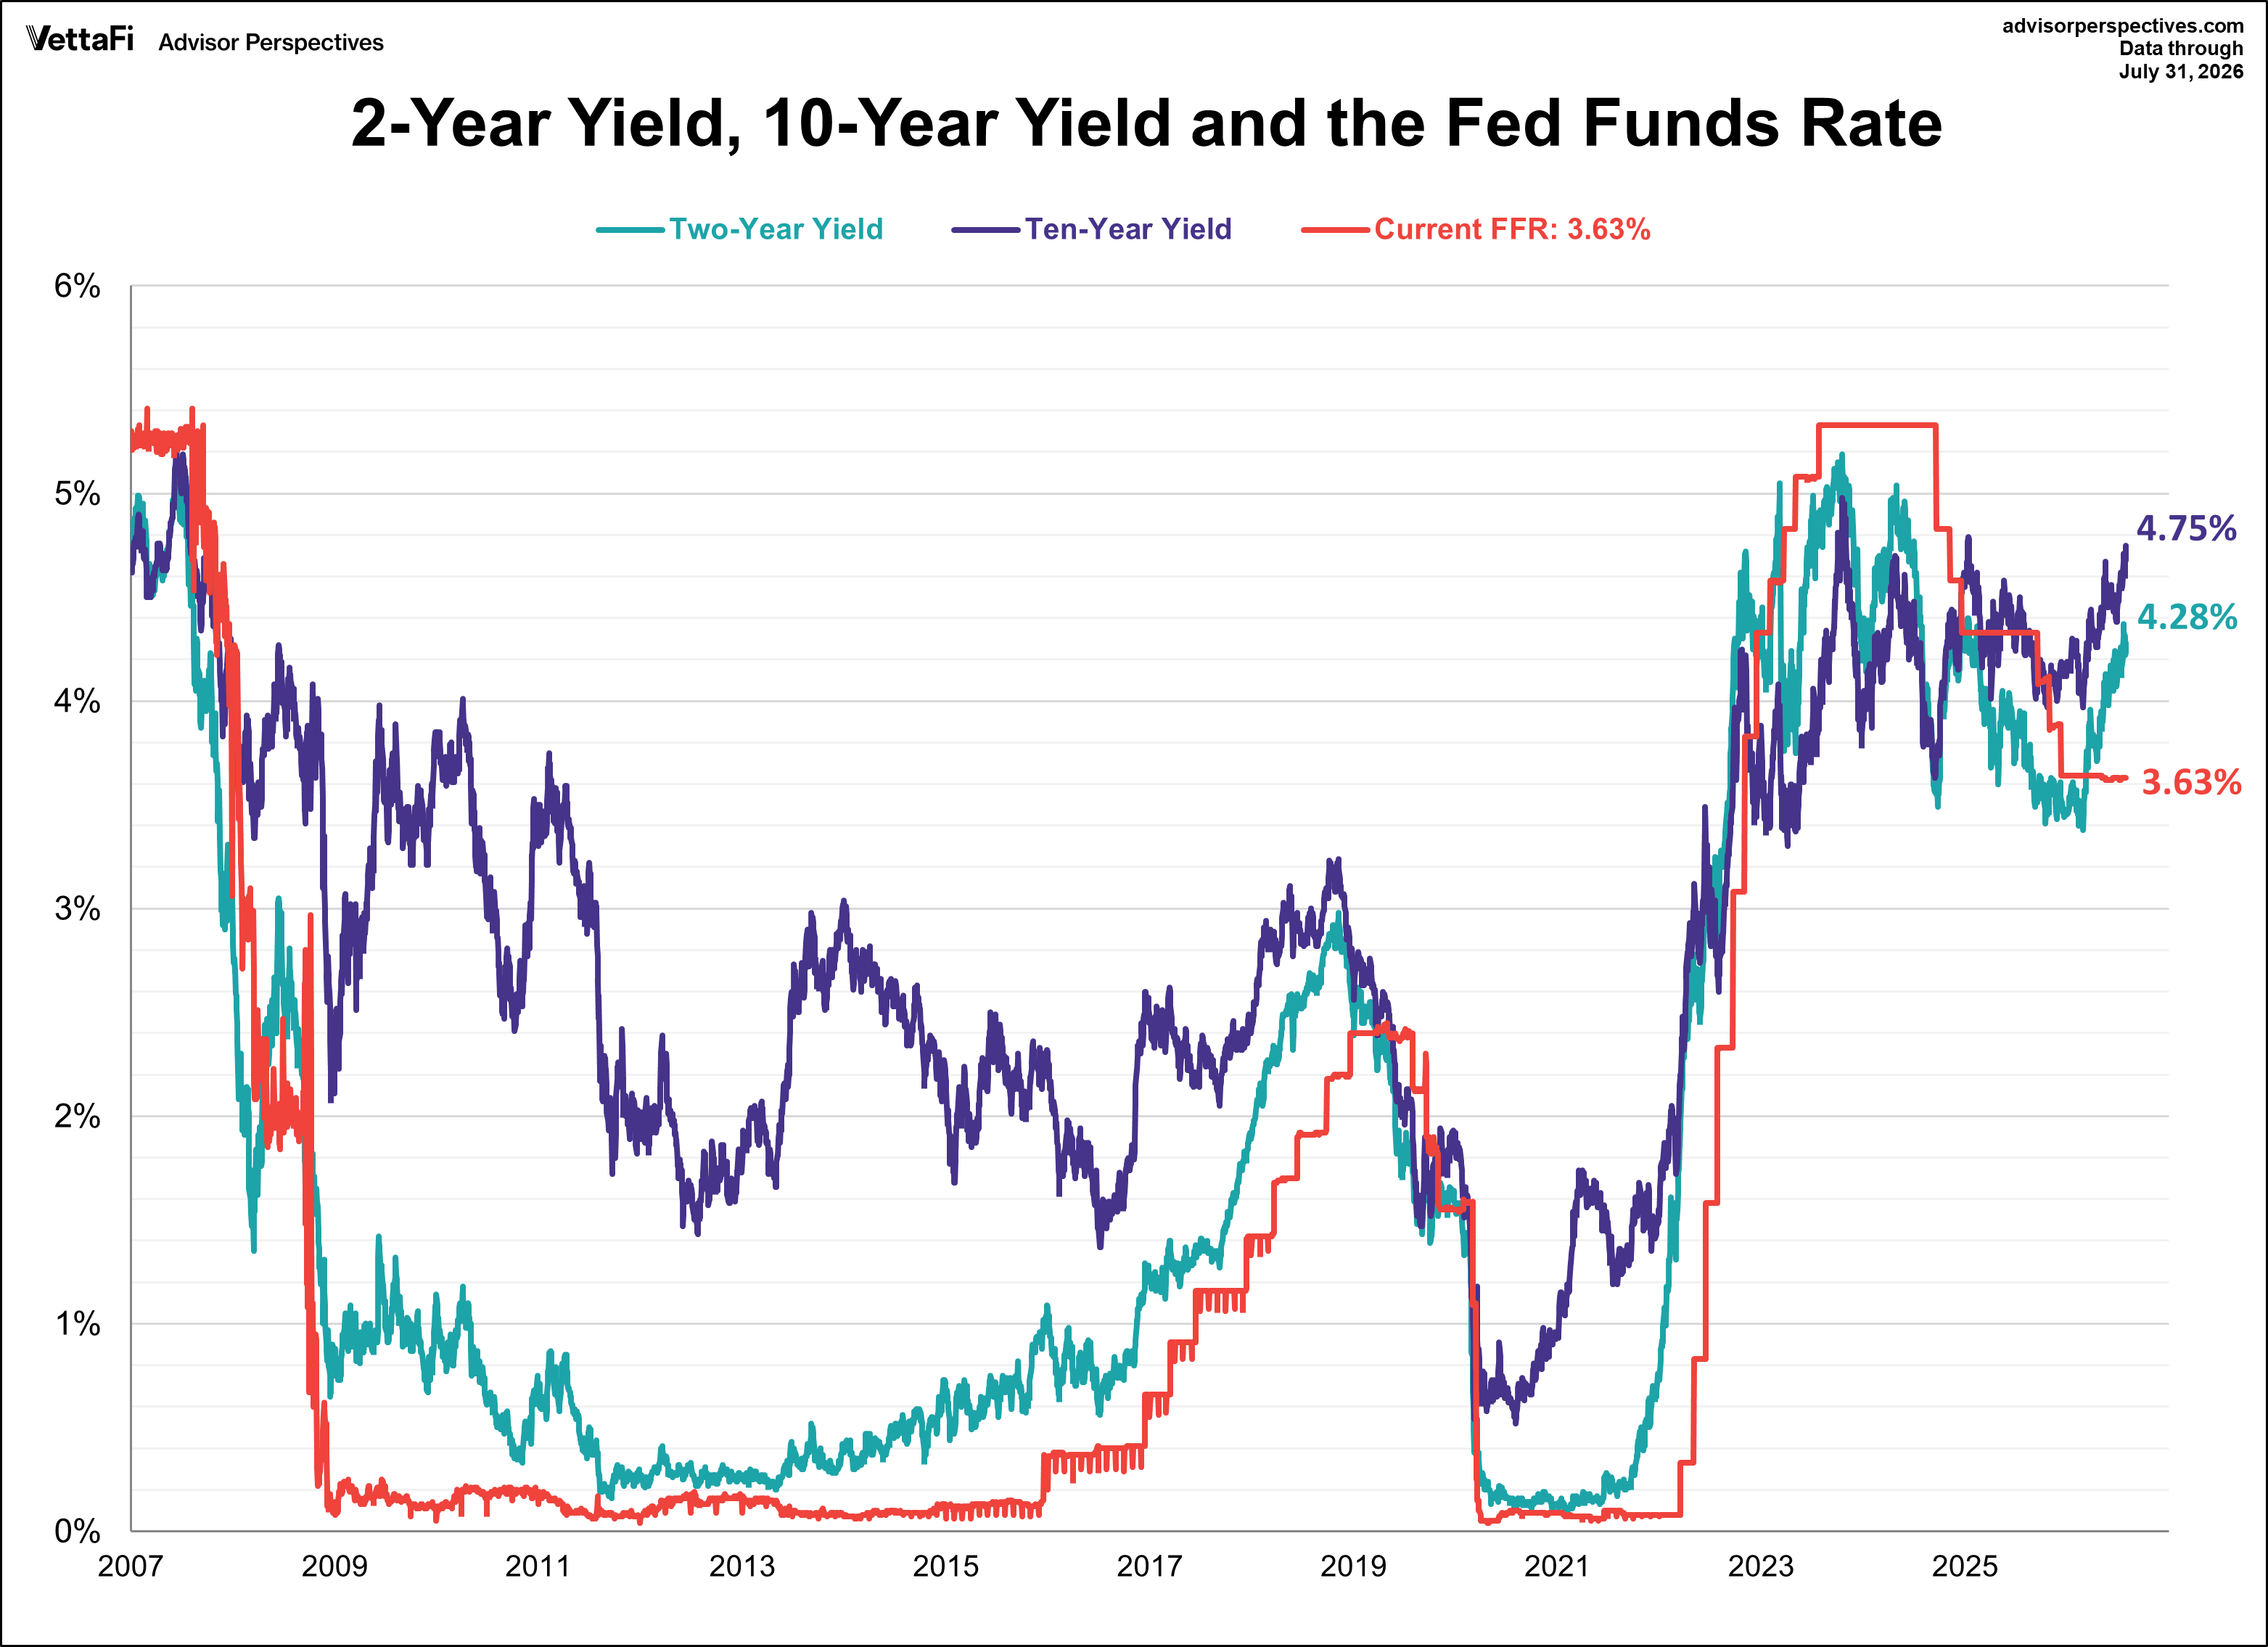
The chart below shows the daily performance of several Treasuries and the Fed Funds Rate (FFR) since the pre-recession days of equity market peaks in 2007.
(Click on image to enlarge)
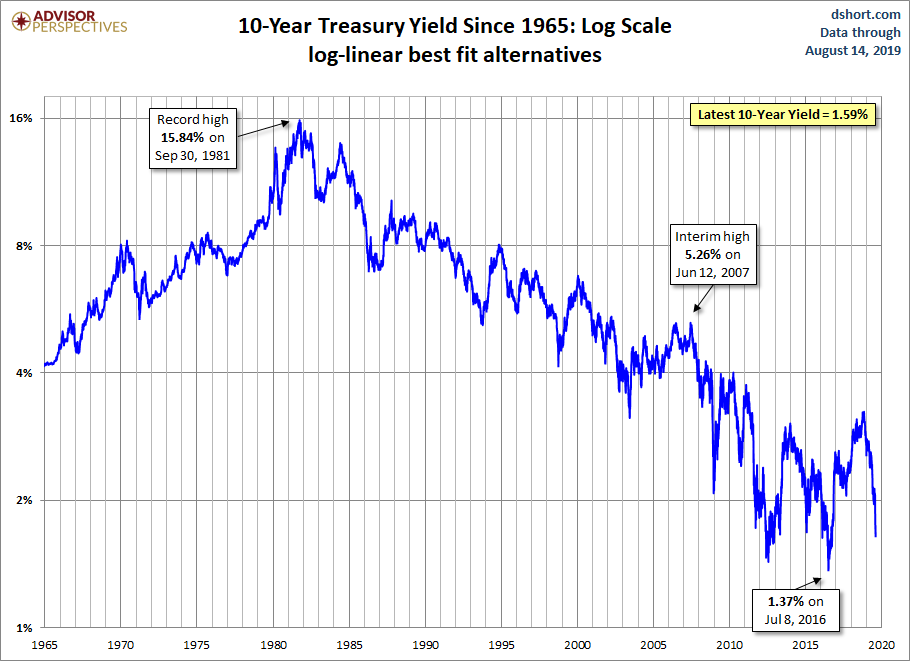
A Long-Term Look at the 10-Year Note Yield
A log-scale snapshot of the 10-year yield offers a more accurate view of the relative change over time. Here is a long look since 1965, starting well before the 1973 Oil Embargo that triggered the era of "stagflation" (economic stagnation with inflation). Note the 1987 closing high on the Friday before the notorious Black Monday market crash. The S&P 500 fell 5.16% that Friday and 20.47% on Black Monday.
(Click on image to enlarge)
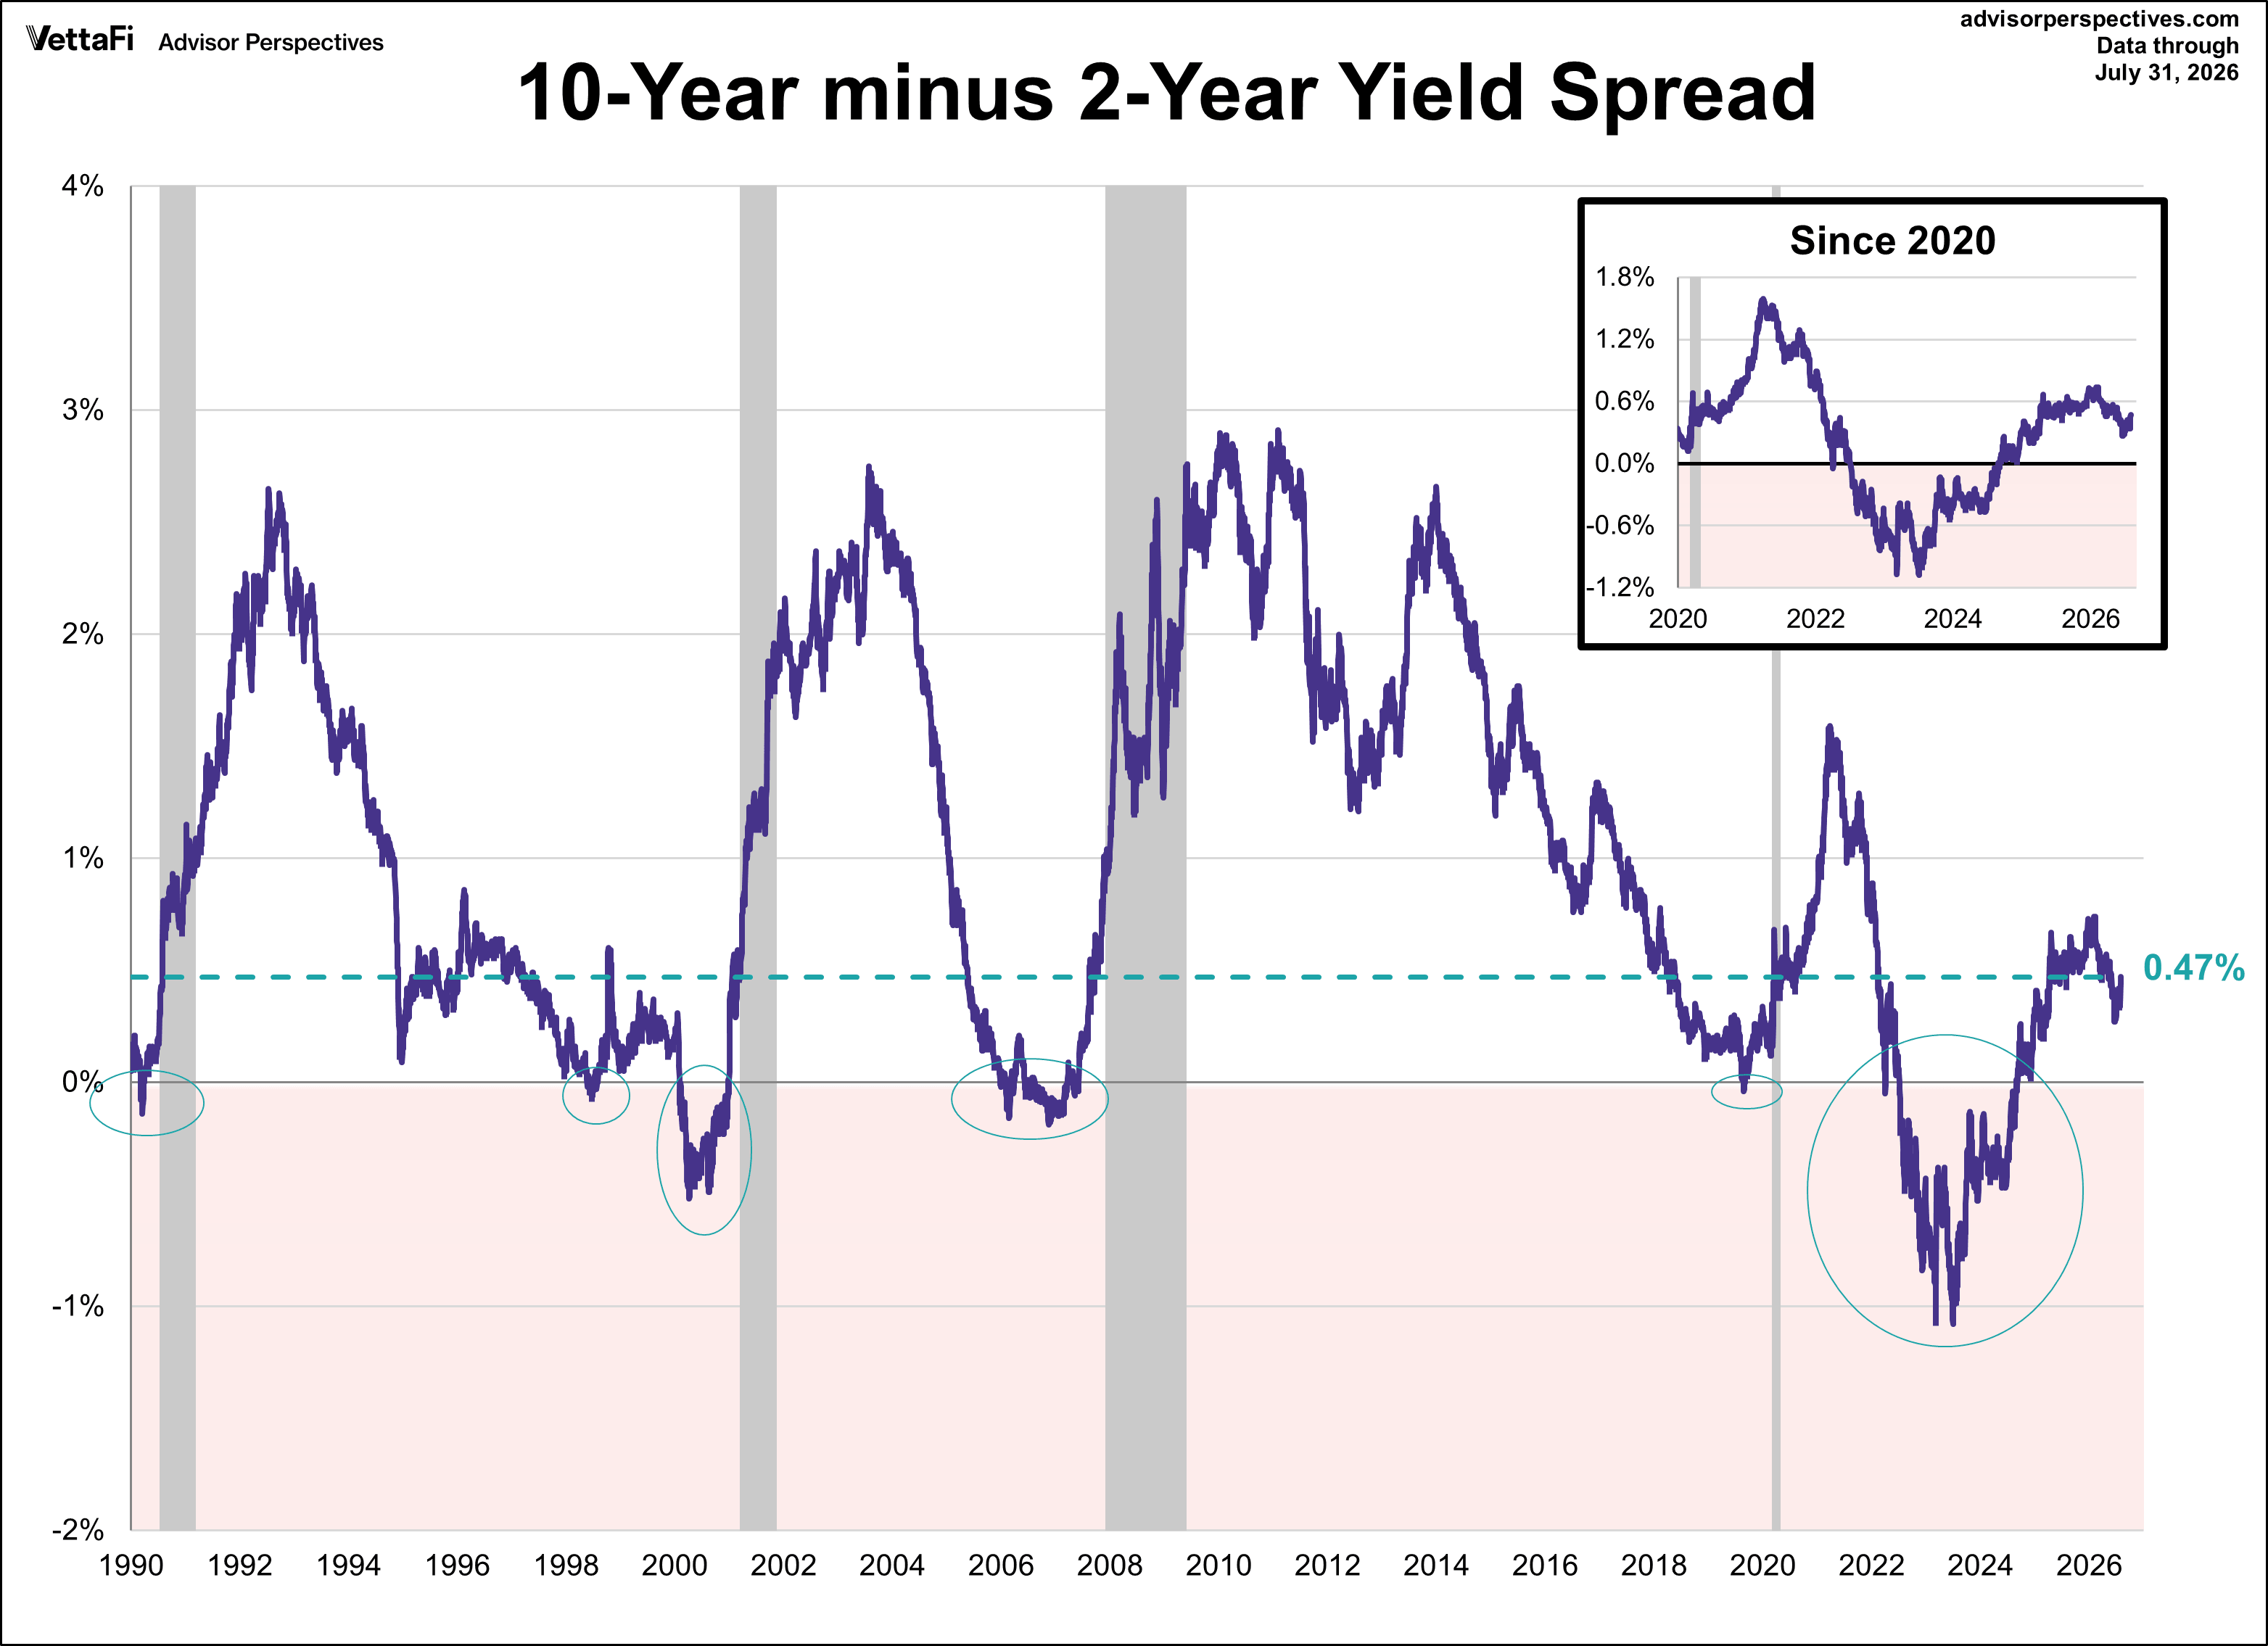
Here's the latest 10-2 spread:
(Click on image to enlarge)
(Click on image to enlarge)
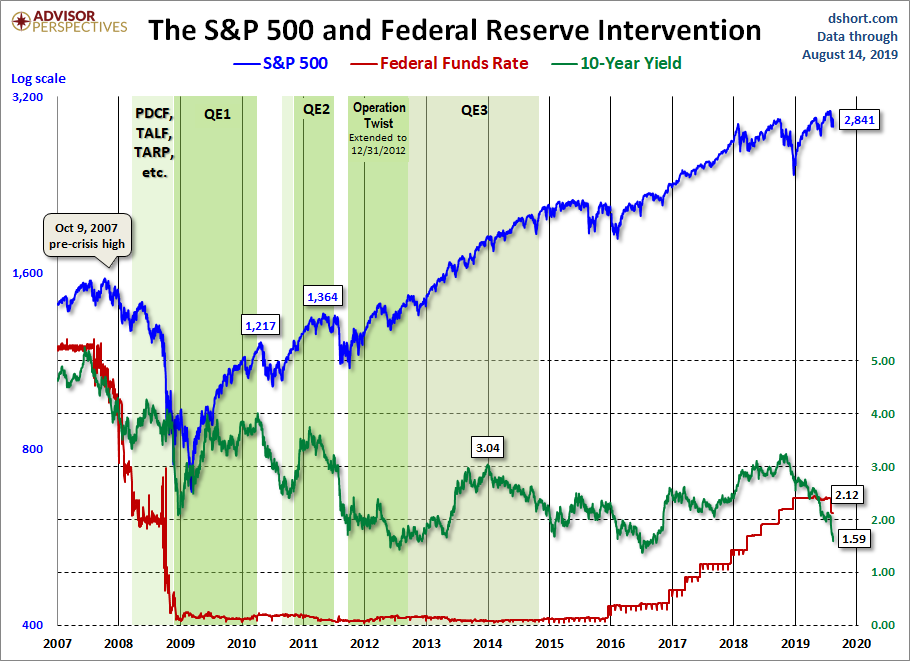
Now let's see the 10-year against the S&P 500 with some notes on Federal Reserve intervention. Fed policy has been a major influence on market behavior.
(Click on image to enlarge)



Comments
Log in or sign up to join the conversation.