

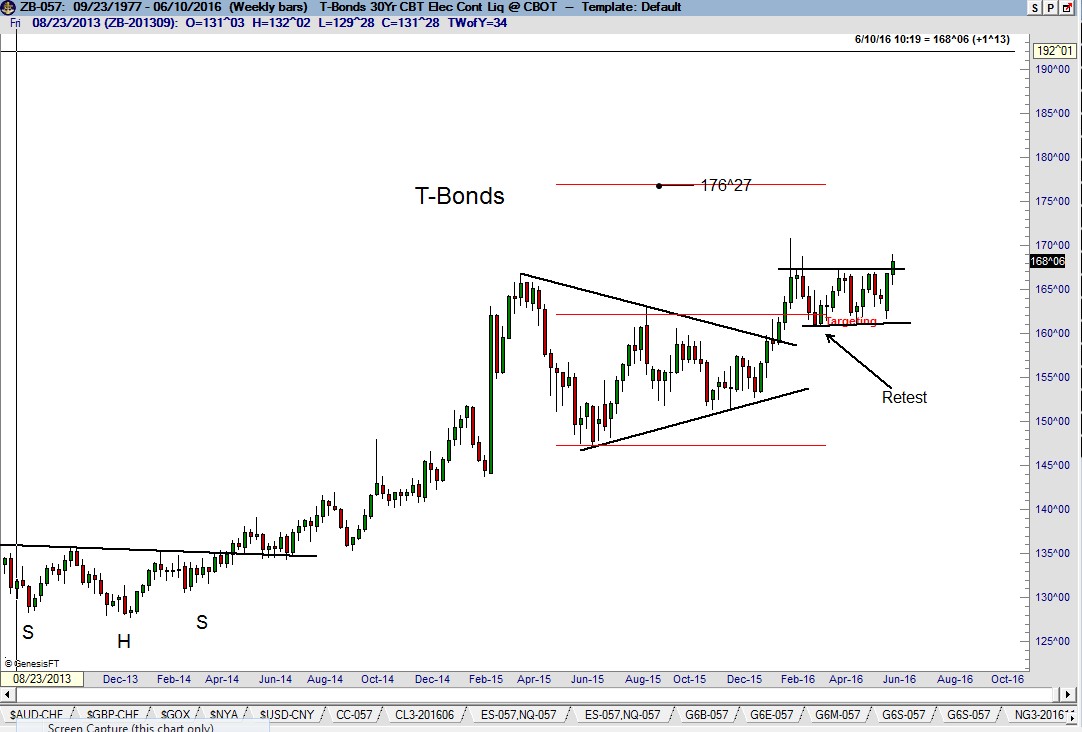
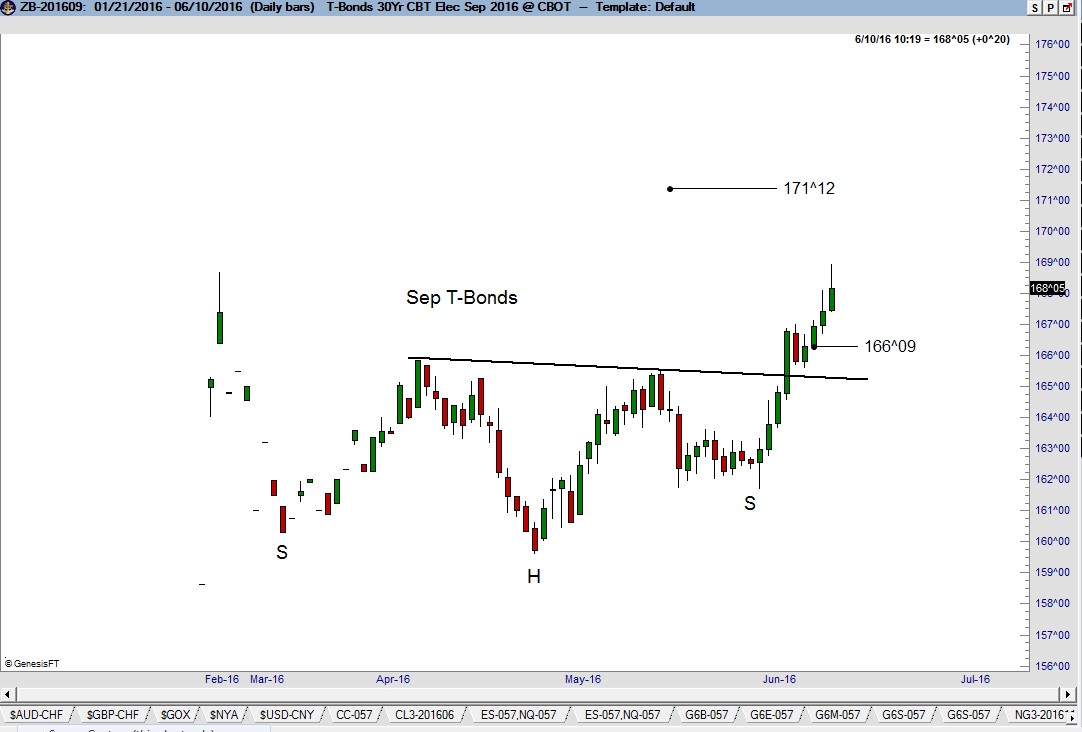
The dominant chart construction in Treasury Bonds (T-Bonds) is the 10-month symmetrical triangle completed on the weekly continuation graph in late Jan. The Sep T-Bonds futures contract has decisively completed a 4-month inverted H&S pattern on the daily graph. The advance this past week also completed the 4-month congestion zone on the daily continuation graph (not shown).
(Click on image to enlarge)
(Click on image to enlarge)
Please forgive me for making a quasi-political statement. The behavior of the U.S. interest rate markets and the jaw-boning of the Fed are at TOTAL disconnect. This highlights two facts – the Fed is incompetent and totally out of control and Janet “The Felon” Yellen is way out of her league.I have known more about U.S. Treasury rates as a chartist than has Yellen as Fed Chief.


Comments
Log in or sign up to join the conversation.