

There is one thing the Strategy Tester does exceptionally well: it can convince you that you have finally figured the market out.
Quick answer: TradingView backtest results can change even when nothing in the strategy changes. As new candles arrive, older candles can fall outside the available historical window, and that shift can affect a strategy's calculations even when its trading dates stay the same. In one example, a 26% result later turned into around 9%.
The table looks neat, the return is green, the win rate is respectable, the drawdown does not look terrifying, and the chart is covered with entries that seem perfectly reasonable in hindsight. If the numbers are especially good, you may already be thinking less about testing the strategy and more about what color the yacht should be. That is roughly the point at which a backtest becomes more dangerous than a bad strategy, because at least nobody trusts a bad strategy.
A recent example shows how easily this happens. The same TradingView strategy, on the same instrument and timeframe, with the same trading period defined in the code, produced roughly 26% in one test and around 9% some time later. Nothing had deliberately been changed. The historical market did not secretly get rewritten overnight, yet the result was very different.
The obvious reaction is to blame TradingView. Sometimes there may even be a good reason to do so. But in this case the more interesting problem is the assumption behind the test. If the code says “trade from May 1 through August 31,” most people naturally assume that those four months have now been sealed inside a laboratory jar and will produce the same experiment forever. In practice, things are not quite that tidy.
Why The Same Backtest Can Produce Different Results
The regular Strategy Tester works with the historical bars currently available to the chart. On intraday intervals, that history is limited by the subscription plan. TradingView currently provides about 5,000 historical bars on Basic, 10,000 on Essential and Plus, 20,000 on Premium, 25,000 on Expert and 40,000 on Ultimate. On daily and higher intervals, the full available history for the instrument can be displayed. TradingView documents those limits here: Historical intraday data: bars and limits explained.
That creates a small trick which is not really a trick at all. New candles keep arriving, and once the historical limit is reached, older candles eventually fall out of the available window. TradingView itself explains that the starting point of intraday history may shift: intervals from 1 to 14 minutes are aligned around the beginning of a week, 15 to 29 minutes around the beginning of a month, and 30 minutes and above around the beginning of a year. TradingView also warns that changes in the starting point can cause strategy results to change over time: Strategies FAQ — Why did my trade results change dramatically overnight?.
So a Pine Script condition saying “do not trade before May 1” is not the same thing as saying “always begin every calculation from exactly the same historical point.”
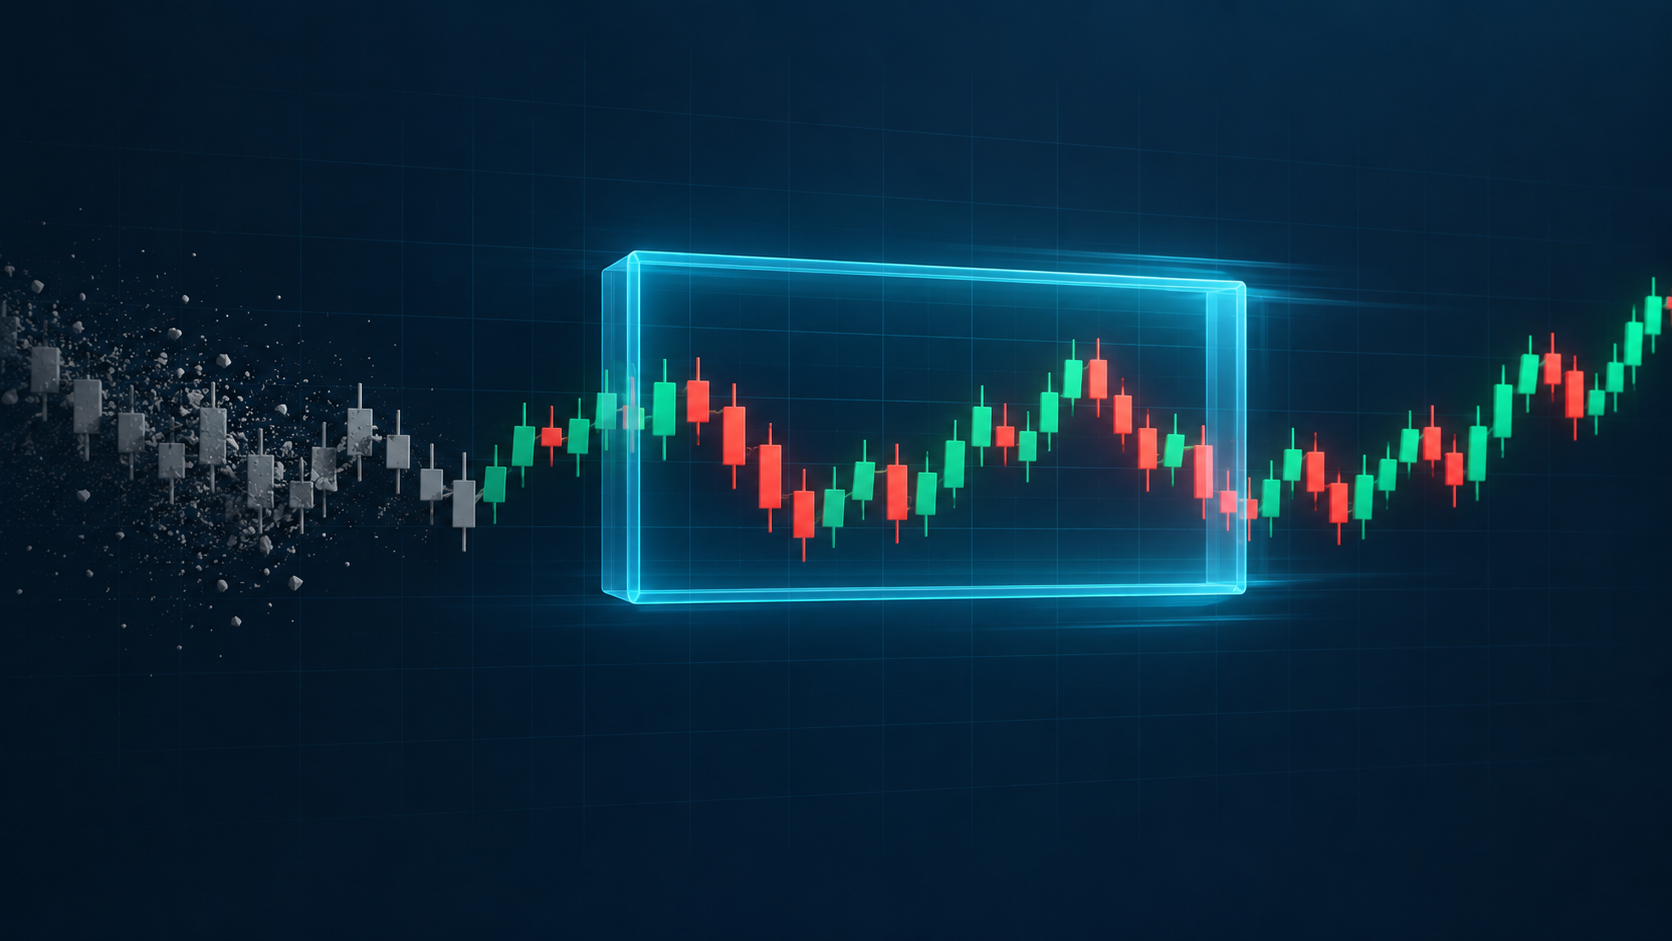
If the strategy uses EMA, RMA, valuewhen, barssince, or anything else that carries state forward from earlier bars, the history before the first trade matters too. Move the starting point, and the indicator value on May 1 may change slightly. One signal may appear a candle earlier or later, the next position may then open differently, and a few dozen trades later the report is no longer the same. Sometimes the difference is trivial. Sometimes a handsome 26% turns into a much more ordinary 9%.
TradingView does not hide this. Its own documentation explains that script calculations depend on their starting point and specifically names functions such as EMA, valuewhen, and barssince among the cases where this matters: Script or strategy gives different results after refreshing the page.
More History Helps—But It Cannot Predict The Future
One obvious answer is to buy a more expensive subscription, get more candles and declare the problem solved. Trading would be wonderfully simple if statistical confidence could be purchased as an account upgrade.
More history is genuinely useful. Five thousand one-minute candles and five thousand one-hour candles represent very different slices of market life. On higher timeframes, the same number of bars covers a much longer calendar period, so the strategy has a chance to encounter more than one kind of market. Premium, Expert and Ultimate also provide deeper intraday history.
Starting with Premium, TradingView offers Deep Backtesting, which is not restricted to the bars currently loaded on the normal chart and can calculate over a selected historical range: How Deep Backtesting works. A single calculation can use up to two million historical bars, subject to the history actually available for the symbol and timeframe: How much data is available for Deep Backtesting?.
All of that makes the test better. None of it turns the test into a prophecy.
This is where people quietly replace the statement “I have more data” with “therefore the result is reliable.” Those are not the same thing. What you really have is a strategy that has been tested more thoroughly on the past.
Markets have an unfortunate habit of changing character just after someone becomes convinced that their character has finally been understood.
A market can trend beautifully for months, spend the next six months chopping sideways, suddenly explode into high volatility and then calm down again. Correlations change, average moves change, clean breakouts turn into false ones, and a system that looked worthy of framing on the wall begins producing one losing trade after another.
A longer backtest is useful not because a longer past somehow knows the future better. It is useful because the strategy has fewer places to hide its weaknesses.
Small Samples And The Optimization Trap
There is another trap that is even simpler: the number of trades. A trader sees a 72% win rate and is impressed. Then it turns out there were eleven trades. At that point we are not dealing with much of a sample; we are dealing with a small dinner party. Change the outcome of two trades and that magnificent percentage suddenly looks very ordinary.
The fewer trades a backtest contains, the easier it is to mistake luck for a pattern. A handful of unusually good entries can make Net Profit, Profit Factor and win rate all look impressive.
If a strategy trades once every two weeks and has only been tested for three months, discussing its “reliability” with great seriousness is a bit like discussing climate based on the weather last Tuesday. A large sample does not guarantee future profit. A small sample, however, gives you many more opportunities to fool yourself.
The deception becomes especially effective when optimization enters the room. Take a normal strategy with a few moving averages, RSI, ATR, stop loss, take profit, perhaps a session filter and a couple of entry conditions. Every parameter has plenty of reasonable values. Run enough combinations and sooner or later RSI 13 looks better than RSI 14, ATR 1.72 looks better than 1.8, and a 2.37% stop looks better than 2.5%. With each adjustment, the equity curve becomes a little prettier.
At that point it is worth asking an uncomfortable question: did we discover a market relationship, or did we simply find the combination of numbers that describes an already known piece of history particularly well?
The past, after all, is extremely easy to predict.
Two million bars do not remove this problem. A strategy can be over-optimized on a huge dataset just as easily as on a small one. It simply takes longer, and the resulting confidence in one's own genius may be considerably stronger.
When Should You Adjust a Live Strategy?
None of this means that strategy parameters should be carved into stone and left untouched for the next ten years. Markets change, and periodically reviewing and tuning a strategy is perfectly reasonable. If a system was calibrated around a particular level of volatility, a certain market structure and a certain style of price movement, there is no good reason to assume that exactly the same settings will remain equally effective under every future regime.
Tune too quickly and every ordinary patch of market noise becomes an excuse to chase the latest candles. Yesterday the parameters were one thing; today the market moved differently, so there are new parameters. Two weeks later the market changes again, so there is another adjustment. Eventually you end up with an excellent strategy that is always perfectly prepared to trade the day before yesterday. Never change anything, on the other hand, and you may spend months trading a model of a market that no longer exists.
And this is where the real problem becomes much more interesting than backtesting itself. Suppose the strategy has been tested properly. Not on twenty trades, not on one convenient month. It has seen different parts of market history, including good and bad periods, and its parameters were not chosen solely because they produced the largest Net Profit.
TradingView alerts are created, the strategy goes live, and for a while the results are more or less in line with expectations. Then performance starts getting worse.
When should something be changed? After three bad trades? Probably not, although the temptation is already there. After ten? After a month of drawdown? After volatility moves far outside the range in which the strategy historically behaved well? Or after a new backtest suddenly produces a very different set of optimal parameters? Perhaps nothing should be changed at all because the current drawdown still falls inside the range that was perfectly normal in the historical test.
This is usually the point where everyone would like a formula. Preferably a short one, with a drawdown percentage and a specific number of trades after which a button can safely be pressed. There will be no such formula here. Not because the question is unimportant. Quite the opposite. It may be the most important question in the entire backtesting process. And the hardest one.
Comments
Log in or sign up to join the conversation.