

At the end of 2020's first month of trading, Equities sold-off sharply after news and developments concerning the Coronavirus pointed to increasing risks of a wide spread pandemic.
While the situation around the Coronavirus didn't escalate further over the successive days, the orders on January 31 was clearly to trade the Short side.
(Click on image to enlarge)
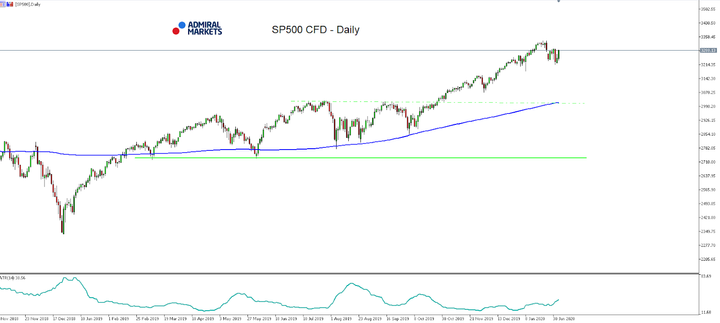
Source: Admiral Markets MT5 with MT5-SE Add-on SP500 CFD Daily chart (between November 1, 2018, to February 4, 2020). Accessed: February 4, 2020 at 10:00 AM GMT - Please note: Past performance is not a reliable indicator of future results, or future performance.
In 2015, the value of the SP500 CFD fell by -0.73%, in 2016, it increased by 9.54%, in 2017, it increased by 19.42%, in 2018, it fell by -6.24%, meaning that after five years, in 2019, it increased by 30.4% it was up by 56.9%.
But before you are given a deeper look into the trading setup and the trade of this specific day, let's recall the 3 steps of the S&P500 Open Range
Breakout strategy:
- Define Open Range between 3:30pm and 4:15pm (CET)
- Identify the advantage: based on the 15-min-EMA (10)
- SP500 CFD trades above > Long,
- SP500 CFD trades below > Short
- Trade the break of the Open Range in direction of the identified advantage,
Stop above/below the high/low of the range (= 1R), Take Profit: "Time Take Profit", meaning that the trade is taken out manually at 9:50pm (CET) if it wasn't stopped out before
In the following, let's go through these three steps and see how the setup would have performed on January 31:
1. The high and low between 3:30 and 4:15pm (CEST) can be found between 3,256.4 and 3,278.1 points, so the Open Range is 3,256.4 - 3,278.1
(Click on image to enlarge)
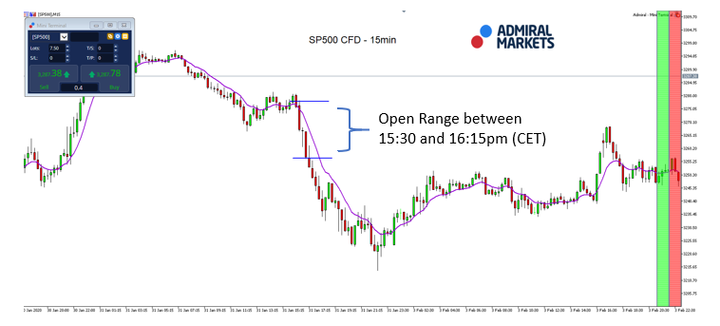
Source: Admiral Markets MT5 with MT5-SE Add-on SP500 CFD 15 minute chart (between January 30, 2020, to February 3, 2020). Accessed: February 4, 2020, at 13:00pm GMT - Please note: Past performance is not a reliable indicator of future results, or future performance.
2. As you can see in the chart above, the SP500 CFD initially traded below the EMA(10) on a 15-minute time frame (purple line). That resulted in the fact that only Short trades were taken and this only if the SP500 CFD breaks out on the downside of the Open Range.
(Click on image to enlarge)
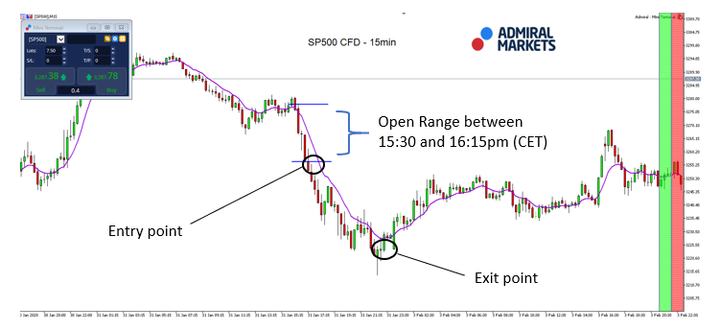
Source: Admiral Markets MT5 with MT5-SE Add-on SP500 CFD 15 minute chart (between January 30, 2020, to February 3, 2020). Accessed: February 4, 2020, at 13:00pm GMT - Please note: Past performance is not a reliable indicator of future results, or future performance.
3. As you can see in the chart above, the SP500 CFD broke out of its Open Range on the downside and started to move in direction of the breakout in the minutes and hours to come.
The stop was placed at the high of the range, resulting in a risk of 21.7 points.
Since the setup works with a Time Stop Out/Take Profit in case of the trade not being stopped out during the trading day, it is taken out at 9:50pm (CEST).
Following this rule, we did so and took the trade out at 3,220.9 points, resulting in a profit for the day and for the setup of 35.5 points and a profit factor of 35.5 points : 21.7 points = 1.6 : 1.



Comments
Log in or sign up to join the conversation.