


Source: Economic Events Calendar January 29, 2020 - Admiral Markets' Forex Calendar
On Wednesday, January 29, the first rate decision of the Fed in 2020 will take place. Market participants currently don't expect a rate cut, in fact, they expect the Fed to stay still with a likelihood of over 90% according to the Fed Watch Tool.
Still, the event could deliver some volatility if the Fed signals any further liquidity over June 2020 to avoid a funding crisis especially in the repo and also follow the market in regards to the expectation of rate cuts in 2020 in general (the Fed dot plot signalled no interest-rate changes in 2020, while the Fed Watch Tool currently points to market participants expecting the Fed to cut rates by December 2020 by 50 basis points with a likelihood of over 60%).
With that in mind, it doesn't come as a surprise that market participants expect the Fed to come out quite dovish at this meeting, even without another rate cut.
That leaves us with the following question: "Is there a chance to somehow trade the Fed statement in any direction, before and/or during and/or after the rate decision?"
The Pre-FOMC Announcement Drift
The answer is: "Yes". In fact, several studies show that a strategy called the 'Pre-FOMC Announcement Drift' has been successful since 1980 and the profitability has even intensified over the last years.
In particular, when the US yield curve flattened out (right now, the 2-10-year US yield curve finds itself in the region around its flattest levels since 2007 with an even inverse structure) and the volatility in US equities (measured via the VIX) was relatively high (which is currently not the case), the 24 hours prior to the FOMC announcement could have been traded very profitably.
On average, nearly 80% of all profits in the S&P500 were made within eight days leading up to the interest rate decision.
In other words: if you bought the S&P500 just 24 hours before the FOMC announcement, you would have earned around 80% of the income of a buy-and-hold investor, but at a much lower risk because you were invested only on 8 days a year.
What is particularly interesting: it didn't matter if the Fed has raised or cut interest rates. The actual interest rate decision brought no overall return. The effect performance-wise was zero in total.
It seems, as if the anticipation of an equity-markets-friendly decision of the Fed was of higher importance.
Why is such a simple strategy working so well?
First of all, the reason seems to be found in the fact that In the week before the Fed decision, there is a so-called "blackout period". That means, that voting FOMC members are not allowed any statements, give interviews or speeches which usually results in a drop in trading volume and liquidity thins out, putting it below average.
Secondly, professional investors usually have a risk-overweight in their portfolio. Before such an risk event like a Fed rate decision, these market participants tend to reduce their risk exposure, rebuild it after the rate decision. So, once the "blackout period" begins, the reduce their engagements and instead buy insurance for their portfolios via futures and options. Due to the low liquidity in the markets during that period, small purchases of equities result in a drift higher in equity markets.
How to Trade The Pre-FOMC Announcement Drift
But now the interesting question: how can we trade this?
We will use the following plan:
- We enter a long position in the SP500 CFD on Tuesday, 28th of January 2020 at 19:55 CET 'Market' at the respective price at this time.
- A big disadvantage of the strategy is that it usually works without a Stop Loss. Since working with no clearly defined risk is no option for us as professional traders, we want to work with a worst-case stop based on volatility.
Therefore, we look at the Daily chart in the SP500 CFD, the indicator ATR(14) and at the average daily trading range of the last 10 trading days.
- The Daily ATR(14) reads ~22 points while the average daily trading range of the last 10 trading days has been ~20 points, too.
- Therefore, our worst case stop should be in the range between 20 to 25 points from our entry point in 1.
- We exit the Long position in the SP500 CFD on Wednesday, 29th of January 2020 at 19:50 CET if it is not stopped out before.
(Click on image to enlarge)
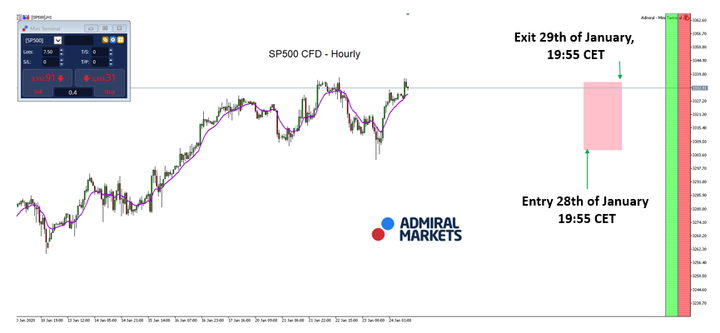
Source: Admiral Markets MT5 with MT5-SE Add-on SP500 CFD Hourly chart (between December 10 to January 24, 2020). Accessed: January 24, 2020, at 10:30am GMT - Please note: Past performance is not a reliable indicator of future results, or future performance.
In 2015, the value of the SP500 CFD fell by -0.73%, in 2016 it increased by 9.54%, in 2017, it increased by 19.42%, in 2018, it fell by -6.24%, meaning that after five years, in 2019, it increased by 30.4% it was up by 56.9%.
(Click on image to enlarge)
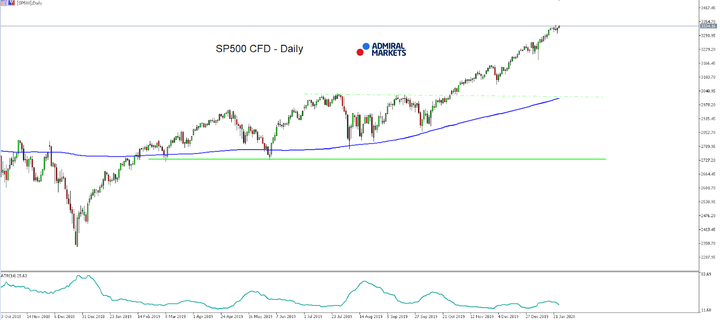
Source: Admiral Markets MT5 with MT5-SE Add-on SP500 CFD Daily chart (between October 23 2018 to January 24, 2020). Accessed: January 24, 2020, at 10:30pm GMT



Comments
Log in or sign up to join the conversation.