

With a darkening fundamental picture, the DAX30 CFD started bearish into the fourth quarter of 2019 and dropped below 12,000 points.
Main initiator for the bearish action was the weakest ISM Manufacturing reading since June 2009 which posted the biggest contraction in September since the end of the 2007-2009 recession and left US president Trump start a new tirade on the monetary policy path of the Fed and its chairman Jay Powell.
And with the unstable political outlook around US president Trump and the formal impeachment inquiry from the Democrats in the U.S. House of Representatives, chances seem high that the German index will continue to struggle.
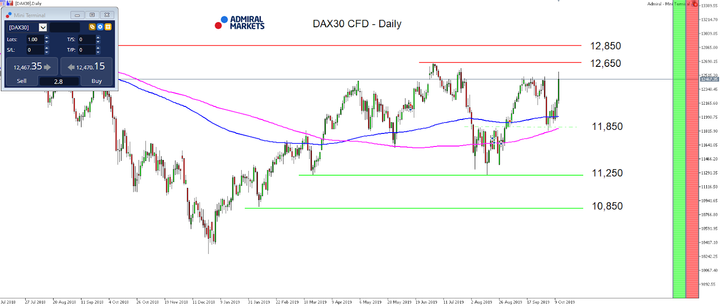
Source: Admiral Markets MT5 with MT5-SE Add-on DAX30 CFD Daily chart (between July 5, 2018, to October 11, 2019). Accessed: October 11, 2019, at 10:00pm GMT - Please note: Past performance is not a reliable indicator of future results, or future performance.
Traders could have profited from the bearish price action several times within the first week of October, particularly on October 2, with a strategy taught in one of Admiral Markets' educational webinars. If you want to learn more about the strategy outlined below – register now for our Trading Spotlight series and learn about it under real market conditions! In addition: join our exclusive Trading Spotlight community and follow various strategies of our experts under real market conditions, see how they perform and what they draw out of their results for their trading!
Let's again recall the 3 steps of the DAX30 CFD open range breakout strategy:
- Define open range between 8:00am and 9:05am (CET)
- Identify the advantage: based on the 5-min-EMA (50)
- DAX30 CFD trades above > Long,
- DAX30 CFD trades below > Short
3. Trade the break of the open range in the direction of the identified advantage,
Stop above/below the high/low of the range (= 1R), take profit: 2R away from the entry point of the trade
In the following, let's go through these three steps and see how the setup would have performed on October 2, 2019:
1. The high and low between 08:00 and 09:05am (CET) can be found between 12,216.6 and 12,253 points, so the Open Range is 34.4 points wide.
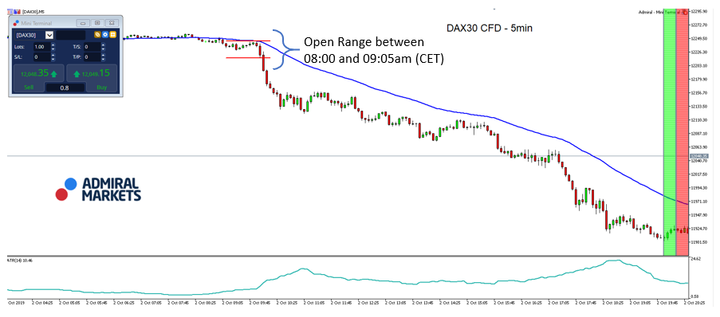
Source: Admiral Markets MT5 with MT5-SE Add-on DAX30 CFD 5min chart (between October 2, 2019, to October 2, 2019). Accessed: October 7, 2019, at 11:30pm GMT - Please note: Past performance is not a reliable indicator of future results, or future performance.
2. As you can see in the chart above, the DAX30 CFD traded below the EMA(50) on a 5-minute time frame (blue line). That means that only short trades will be taken and only if the DAX30 CFD breaks out on the down-side of the Open Range.
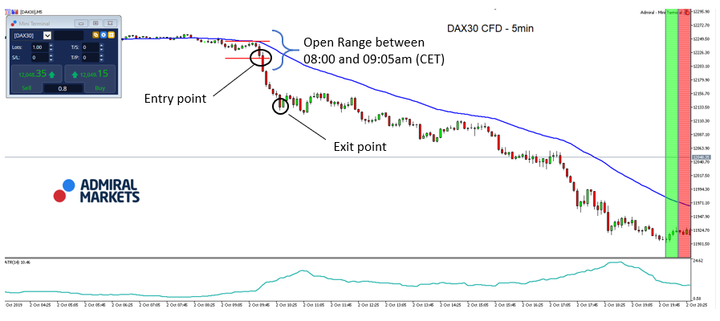
Source: Admiral Markets MT5 with MT5SE Add-on DAX30 CFD 5min chart (between October 2, 2019, to October 2, 2019). Accessed: October 7, 2019, at 11:30am GMT - Please note: Past performance is not a reliable indicator of future results, or future performance.
3. As shown on the chart above, the DAX30 CFD broke out of its open range on the downside and started to move strongly in the direction of the breakout on the downside.
The stop was placed at the top of the range at 12,253.09 resulting in a risk of 34.4 points.
Since the setup works with a Take Profit 2R away from the entry point of the trade, a Buy Limit was placed at 12,147.88 points, 68.73 points away from the entry point.
The target was hit within the next hour, resulting in profit of 68.73 points and a profit factor of 68 points : 34 points = 2 : 1.
In 2014, the value of the DAX30 CFD increased by 2.65%, in 2015, it increased by 9.56%, in 2016, it increased by 6.87%, in 2017, it increased by 12.51%, in 2018 it fell by 18.26%, meaning that after five years, it was up by 10.5%.



Comments
Log in or sign up to join the conversation.