
Welcome to this week’s State of the Markets with Wayne Nelson and Seth Golden. In this week’s SOTM we discuss the vast variety of variables affecting the equity markets as they climbed toward new highs and have since retreated due to the narrative surrounding increased tariffs. Please click the link to review the video, which runs about 59 minutes.
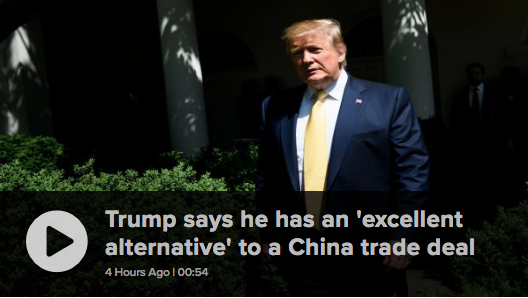
- Discussion surrounding the binary potential for market reaction surrounding the outcome of the latest U.S./China trade talks in Washington D.C.
- If tariffs are raised come Friday morning, the market will likely react negatively and force analysts and economists to review the impact from rising tariffs and geopolitical tensions surrounding trade.
- Both sides of the trade have committed to a great deal of posturing leading up to these latest talks. The public has no means to verify ongoing status of negotiations beyond what the regimes are indicating. (0-7 minutes in)
- Market has needed a healthy pullback after remaining in overbought territory for the last couple of months. The catalyst came from the latest trade skirmish. (0-8 minutes in)
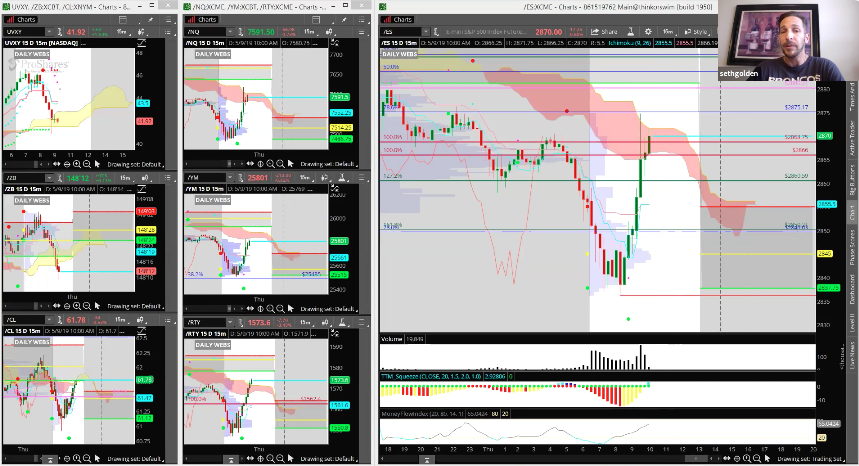
- Intraday look at real-time market activity with our technical analysis from Wayne Nelson. Discussing the V-shaped intraday recovery off of the lows.
- The Ichimoku Cloud is a collection of technical indicators that show support and resistance levels, as well as momentum and trend direction. It does this by taking multiple averages and plotting them on the chart. It also uses these figures to compute a "cloud" which attempts to forecast where the price may find support or resistance in the future. The Ichimoku cloud was developed by Goichi Hosoda, a Japanese journalist, and published in the late 1960s. It provides more data points than the standard candlestick chart. While it seems complicated at first glance, those familiar with how to read the charts often find it easy to understand with well-defined trading signals.
- President Trump to meet with Prime Minister Abe in Japan scheduled for May 25–28. Very likely to bring the successful resolution of a U.S.-Japan bilateral trade agreement. If we get similar positive news from the U.S.-China trade front, Japan in general and exporters, in particular, could outperform. (9-17 minutes in)
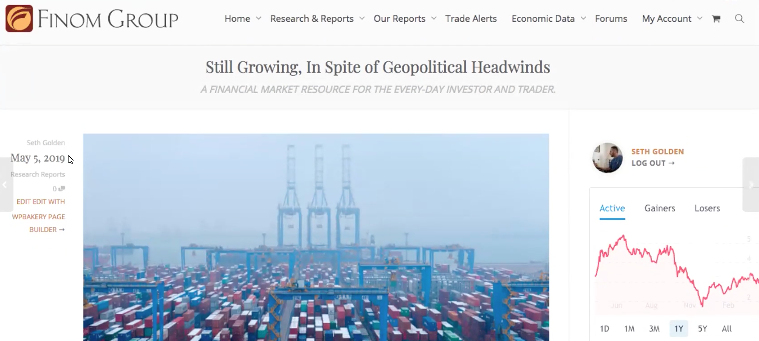
- Discussing our weekly Research Report and the push into a large cash position in the previous trading week. Cash position was outlined in the Research Report at 80% weighting of Golden Capital Portfolio.
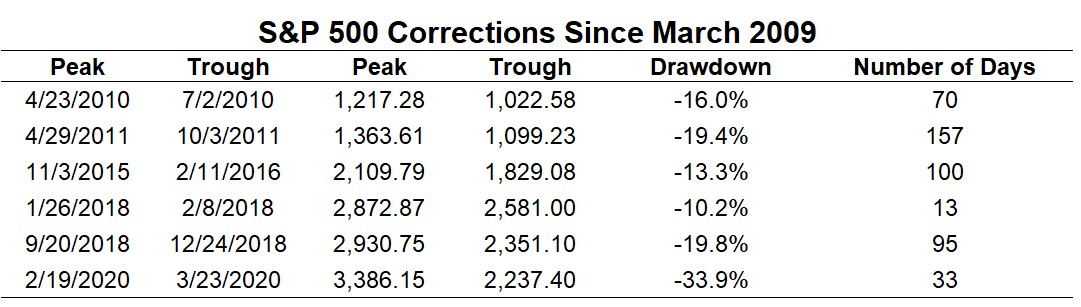
- If tariffs are raised and market declines, this decline is not likely to mirror that of the Q4 2018 decline as that occurrence had a large FOMC correlation and the failed messaging of the Fed. This time we have a Fed which is sidelined and low rates. (18-23 minutes)
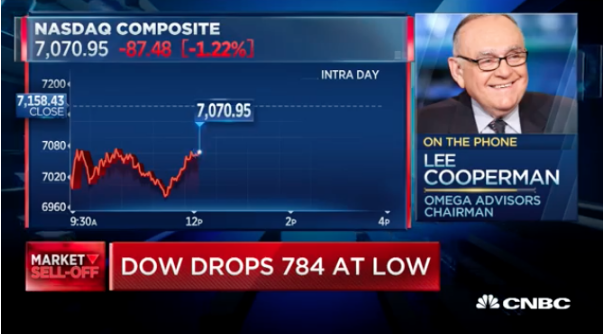
- Famous fund managers appear on television and discuss their outlook for the financial markets, but have a far greater time horizon than the average investor and don't feel the pains of short-term market downturns the same way. Additionally, they are no better or worse forecasters of the market than the average investor.
- Leon Cooperman had a terrible market call in December 2018 as identified by his appearance on CNBC back in 2018.
- "Equities were found rebounding right around 11:30 and during a CNBC live interview with hedge fund manager Leon Cooperman
- Market participation and experience lends itself to improved market participation. (23-30 minutes in)
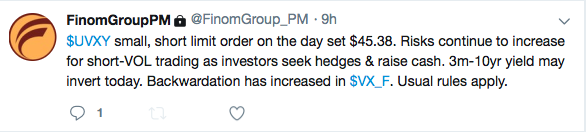
- As the market pulls back investors can still find trading opportunities using a disciplined strategy and exercising caution by limiting position entry size.
- Not a lot of impactful economic data to discuss as CPI and PPI were likely not going to show signs of rising inflation. Mortgage rates have also taken another leg lower this past week.
- Housing may be forming a bottom. Next week investors will await monthly retail sales, Housing Starts and Building Permits data.
- With the current White House Administration, one should not expect prolonged periods of market and geopolitical complacency. Having said that, 2019 has found the S&P with little volatility and lacking a significant pullback. Up until now the only other time through the first 5 months of the year, only 1995 had lesser drawdowns as shown in the chart below (LPL Financial):

Comments
Log in or sign up to join the conversation.