

In the past trading week, investors/traders were once again at the mercy of trade headlines. It was only 2 weeks ago that “the tweets seen round the world” sent global equities tumbling. The tweets from the Real Donald Trump Twitter account stated that existing tariffs would be elevated from 10% to 25% and that is what has found equities under pressure ever since. Although the trade feud between the U.S. and China has heated up of late, investors should consider the S&P 500 (SPX) is less than 3% from its record closing price.
Last week was the 2nd week in a row in which the weekly expected move was breached to the downside on the first trading day of the week. Another not-so-fun-fact about the S&P 500’s performance this past week was that the benchmark index traded lower in the last hour of trading every day. Nonetheless, it is still performing better than the Dow Jones Industrial Average (DJIA).
For the first time in almost 3 years, the Dow saw its fourth negative week in a row. The blue-chip index is now more than 4% below its record high hit on Oct. 3, 2018. This is the first time since Donald Trump was elected that the Dow has closed lower than the week before for 4 straight weeks. Here's how the Dow did the week after each of the last 20 losing streaks of 4 weeks or more.

Based on the table, the coming week has a strong probability of being an up week for the Dow, if history is any guide at least. But Friday proved to be quite the disappointing trading day for the bulls with the market reversing its early morning losses and with the S&P looking like it was going to close above the 50-DMA for the week; that was before it happened of course.

Going into the final hour of trading, headlines confirmed what was already reported in the early morning hours; China didn’t feel a desire to continue trade negotiations. China propped up its currency and cut U.S. pork orders, while state media took on an increasingly nationalistic message. The Trump administration, meanwhile, put Chinese telecommunications company Huawei and its affiliates on a business blacklist and banned it from the supply chain, actions it had shelved earlier in the trade talks to smooth relations. While this was all taking place on Thursday and into early Friday morning, U.S. equities found their footing and reversed all losses upon the release of better than expected economic data. But then the gains turned into declines once again at 3:00 p.m. EST
China had invited the U.S. delegation to Beijing, and earlier this week, Treasury Secretary Steven Mnuchin appeared open to accepting the offer. But sources say scheduling discussions have not taken place since the Trump administration ratcheted up its scrutiny of Chinese telecom companies. The breaking news late Friday afternoon sent stocks tumbling into the close and found the S&P 500 failing to close above its 50-DMA.

But then in the evening hours, the U.S. Commerce Dept. offered its own headline, with investors and trading desks closed for the week.
- The Commerce Department, which had effectively halted Huawei’s ability to buy American-made parts and components, is considering issuing a temporary general license to “prevent the interruption of existing network operations and equipment,” a spokeswoman said.
- In effect, the Commerce Department would allow Huawei to purchase U.S. goods so it can help existing customers maintain the reliability of networks and equipment
- But the Chinese firm still would not be allowed to buy American parts and components to manufacture new products.

This is just the kind of olive branch needed to bring both parties back to the negotiating table. Investors are hanging on and reacting to every single trade headline of significance and the market has been whipsawed back and forth as the headlines and tweets seem never-ending. Equity futures headed higher Friday evening after the U.S. Commerce Dept. headline.
It has been made very transparent of late that neither the U.S. nor China desires a protracted trade feud that creates economic and financial market weakness, if not downturns. To the degree that equity markets fall, they are quickly given to rise again with some positive characterization on trade talks between the two nations. We’ve described this anomaly in the market as the “Trump Put”. Observing actions of the U.S. White House Administration makes it apparent to us that the tone and sentiment towards the trade war changes with roughly ~100 points on the S&P 500. The market moving higher generally leads to a hardened stance and more confrontational tone, and the market moving lower generally leads to either verbal or actual progress towards trade resolution. (JPM) As such, it’s no surprise that after Monday’s market route, the Administration acted to negotiate a repeal of U.S. steel and aluminum tariffs imposed on Canada and Mexico. By Thursday, the 3 parties had an agreement to repeal all levied and retaliatory tariffs.

The United States agreed Friday to lift its tariffs on industrial metals from Mexico and Canada, clearing a major obstacle to congressional passage of President Trump’s new North American trade deal.
The bargain calls for Mexico and Canada to adopt tough new monitoring and enforcement measures to prevent subsidized Chinese steel from being shipped to the United States via their territory. In return, the United States will lift its tariffs in 48 hours.
I have been pretty ahead of the game when it comes to its outlook on the trade feuds and tariffs front. This is not to suggest that the trading environment has been smoothed from our analytical offerings on the global trade issue, but here is what I offered just last week in my weekly Research Report (from finomgroup.com) discussion on tariffs and trade.
“While the S&P 500 fell 2.18% last week, investors and strategists feared a far worse decline. This does not exonerate declines in the coming weeks, but it does suggest that investors remain optimistic that a trade deal of sorts will be reached or that more tariffs on an additional $300bn in goods will not be levied. Additionally, investors may be taking solace in the notion that the FOMC and/or President may desire to support the economy and stock market should either falter, by cutting rates and/or retracting certain tariffs in favor of a trade deal. Either way Finom Group always recommends focusing on fundamentals i.e. valuation, earnings, and economic risk. These all remain attractive for long-term investors who ignore the emotional ebbs and flows of the market on any given day. Think first about your risk. Only then should you consider the possible rewards from taking said risk!”
For the coming week, and with a more conciliatory sentiment put forth from the U.S. on Huawei’s business dealings, I am of the opinion a positive trade headline will be put into motion for talks to reengage. Having said that, this does not exonerate the possibility of some aspect of global trade headlines going awry should the market accelerate. To reiterate, as the U.S. market seems to move higher, the U.S. Administration has become more aggressive in their tone on trade with various partners around the world.
Reverting back to our focus on the markets and the S&P 500, with all the back and forth action, the 14-Day RSI might appear as though the market is oversold, on the surface at least.

A closer look at the chart of the S&P 500 and RSI above shows that the market is nowhere near as oversold as it was in February, October or December of 2018. Furthermore, as of Friday morning, most Index ETFs had briefly recaptured their 50-DMA. (Table from Bespoke Investment Group)

In order for the S&P 500 to recapture and hold above it’s 50-DMA near-term, it’s going to need the support of the financial sector (XLF). As we discussed in the Finom Group Live Trading Room all week, the XLF needs to hold above a significant gravity point of $26.50 and resume its uptrend.

On Wednesday it nearly hit this gravity point before bouncing higher. While large-cap stocks are always being introduced as supportive to the S&P 500, like Apple (AAPL), they simply aren’t big enough to offset market declines in the event that the financial sector falls apart, as it did in Q4 2018.
For the coming week, the S&P 500 weekly expected move has come in just a bit. This past week’s expected move was $54/points (breached on the first trading day of the week), but with the VIX falling by .5% in the past week the weekly expected move for the coming week has fallen to $52/points.

Market Volatility
Yes, the VIX actually fell last week. It’s hard to believe given the large market drawdown and surge in the VIX on Monday. But with positive market days on Tuesday, Wednesday and Thursday, the VIX fell just as quickly as it rose. This is something that I have been forecasting and expecting in the way of the current volatility regime which has been heavily long VIX-ETPs for much of 2019. In each of the past 2 weeks, the VIX rose above 21 and dipped back below 15. That is a first historical occurrence for...
- VIX over 21 and
- Below 15
- During the same calendar week
- For back-to-back weeks?
- In fact, it had never happened twice in a *month* before.
While I have previously outlined the VOL targeting strategy positioning, JPMorgan Chase & Co. analysts Marko Kolanovic and Bram Kaplan, in a recent note, have some theories as to why the VIX has seen relatively muted action amid the geopolitical turmoil.
Since May 5, when President Donald Trump issued a tweet signaling a reignition of Sino-American trade tensions, investors pulled over $300 million from unlevered long VIX products, and over $450 million from levered products, including the ProShares Ultra VIX Short-Term Futures ETF (UVXY). Unwinding of this exposure has kept in check the increase in the VIX and prevented the type of VIX increase we saw in February and October last year.”
We observed that hedge funds’ equity beta slightly increased in the week of May 6rd (e.g. HFRXGL equity beta increased from ~5th to 15th percentile). The quick pullback likely exposed the convex long exposure of funds, and on margin attracted fundamental buying. CTAs’ equity beta also marginally increased. This is particularly interesting and indicates positioning that was lagging historical 6-12M trend signals and potential implementation of short-term reversion signals (designed to avoid setbacks like we saw in February or October last year). We estimate equity exposure of the volatility targeting complex to be in the ~35th percentile, CTAs ~40th percentile, and exposure of broad HF benchmarks ~15th percentile. Retail investors continued pulling money out of the market (~$50bn of fund outflows YTD).
The J.P. Morgan strategists say positioning, or bets on VIX, remain subdued and said that they are expecting stocks to see similarly muted action, barring any new Twitter flare-ups from President Donald Trump. “This is consistent with our last report, where we pointed out that pullbacks are likely to be less severe compared to those last year,” the analysts said.
And when we review the COT noncommercial (hedge fund) VIX Futures positioning we can identify that indeed the short position has declined in each of the past 2 weeks. The coming week represents a VIX Futures expiration week with May Futures expiring and back month futures rolling forward (June Futures will become m1).

To-date, my 2017 VIX-redux characterization of the Volatility complex continues to prove itself. While the masses assumed 2019 would be another highly volatile year for the market, they haven’t been proven entirely wrong of late, but the seeming “Trump Put” coupled with a “Fed Put” has kept volatility in check to a greater degree than in 2018 and when the Fed was hiking rates.
As it pertains to where the VIX might be heading next, that is of lesser consequence than being prepared for what may come next in the marketplace. Nonetheless, we aim to understand that the VIX is currently in “no man’s land”, so to speak. Take a look at the Citi Edge chart below:

As depicted in the chart, the VIX is straddling somewhat of a “no man’s land” territory currently. Going back to 2000, the VIX has only spent 18% of the time between 15-19. It spends most of its time (represented by the % indication) either below 15 or above 19.
Weekly Economic Data
The economic data releases for the past week were largely better than expected. The week kicked off with the NFIB index rising for the 2nd month in a row, even if ever so slightly. The latest NFIB small business sentiment index rose in the month of April. The index rose 1.7 points to 103.5, with 8 out of 10 components increasing, led by earnings trends.
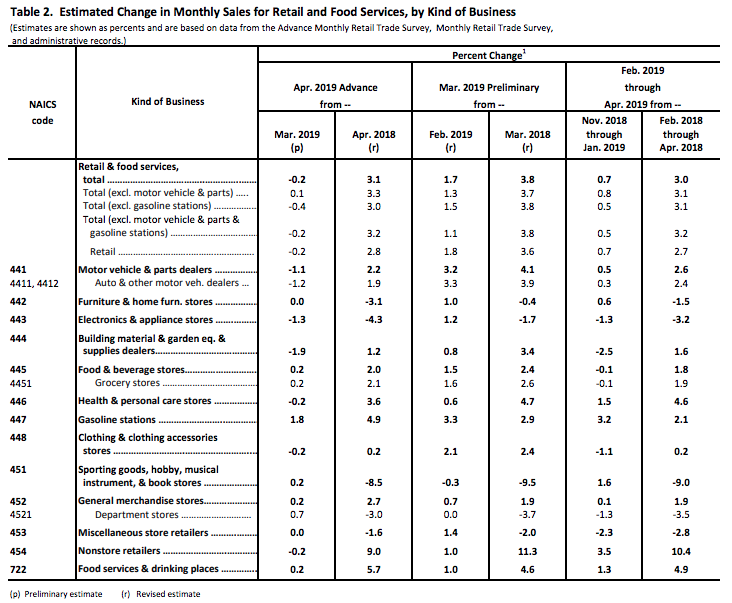
From there came a disappointing .2% MoM decline in April retail sales. Some seasonality factors played a role in the April retail sales data, which were the usual weather impact and the possibility of tax refund and payment issues. While the MoM decline was below that of the economists’ expectation for a slight rise, the YoY 3.1% rise in retail sales proves the economy remains on steady ground and the consumer has increased consumption.
With the consumer front of mind lately, the New York Fed also released its Q1 2019 Household debt report. The report showed the natural rise in household debt, but most every debt category remains healthy in terms of serviceability and delinquency rates.

As shown in the chart above, the only delinquency category that shows some signs of concern would prove to be auto loans.
The Empire State and Philly Fed manufacturing index, NAHB homebuilders index, Housing Starts and Building Permits all rose nicely in the month of April, as reported this past week. Initial Jobless claims fell for a 3rd consecutive week and to 212,000. And while retail sales were the standout disappointment, consumer sentiment soared to a 15-year high. The University of Michigan’s consumer sentiment index in May climbed to a reading of 102.4, a 15-year high, from April’s reading of 97.2. Economists polled by MarketWatch expected a reading of 97.1.

The index for consumer expectations shot higher, rising to 96 from 87.4 in April. That’s the biggest jump in expectations since December 2011. The measure of current economic conditions only edged up a tenth of a point to 112.4. The expected inflation rate for the next five years rose to 2.6% from 2.3%, which had been the series low.
“Generally speaking, we’ve seen weaker hard data for April – core retail sales and industrial production, but sentiment or survey based data for May have come in strong for factories, housing and the consumer. This suggests underlying growth is reasonably healthy,” said Neil Dutta, head of economics at Renaissance Macro Research.”
The final data point of the week came by way of Leading Economic Indicators. A survey of U.S. economic conditions rose for the third straight month in April, touching 112.1, the Conference Board said Friday.

This is a new cycle high for the LEI. In the past 50 years, it has peaked a median of 10 months before the next recession and 3 months before the S&P 500 peaks. If history repeats itself, investors should expect a new S&P 500 highs in the months to come.
For the coming week, the economic calendar is lighter than the previous week, but the housing sector heavy.

While we should continue to monitor the strength or weakness in the economic data, it does not fail to catch investors’ attention that the FOMC meeting minutes will also be released this coming Wednesday. The aforementioned “Fed Put” will be called to the forefront this week as investors comb through the FOMC minutes for any deviation in the Fed’s dovish 2019 pivot.
When I review the Fed rate cut expectations and couple it with the bond market move through 2019, both elements find a unique set of circumstances competing with the risk trade.
- The dovish Fed pivot usually precedes a rate cut and as such, the market quickly moved to price such an action.
- Beyond that, the global economy weakening further fueled the probability of a rate cut.
- Lastly and probably more impactful, the global trade feud between the U.S. and China has the potential to curtail global economic output even further.
All these bullet points noted have found bonds rising and yields falling since January 2019. The latest developments within the trade feud will likely continue to pervade business and capital expenditures and pressure manufacturing output. While I still anticipate a trade truce this summer, a true deal may not come to pass. Moreover, a deal may not be necessary at this point. The markets would likely find no further escalation of tariffs enough to quell economic fears. As long as the final $325bn in tariffs at the 25% rate are not implemented, the equity markets would likely continue higher on the heels of earnings growth and trend-growth in the economy.
Lastly, and with respect to the rate cut discussion, the market may prove disappointed if the Fed does not tilt its messaging more in-step with the probability of cutting rates by the September meeting. I believe if the market has continued higher and the Fed doesn’t lend itself to such messaging, a sharp equity market correction could commence thereafter!
Fund Flows
While there seemed to be a reversal of fortune for equity ETF fund flows through April, that optimism has been quickly tempered with two consecutive weekly outflows taking place in May. According to Lipper U.S. Weekly FundFlows Insight Report, money market funds drive overall net inflows for the third straight week, but equity ETFs saw net outflows for the second consecutive week.
Lipper’s fund asset groups (including both mutual funds and ETFs) had net positive flows of $3.9 billion for the fund-flows trading week ended Wednesday, May 15. Money market funds (+$14.5 billion) were responsible for the lion’s share of the net positive flows for the third straight week. The municipal debt fund (+$1.3 billion) and taxable bond fund (+$434 million) asset groups also contributed to the net inflows. Equity funds saw money leave their coffers (-$12.3 billion) for the fourth straight week. Equity funds have experienced slightly less than $25.0 billion in net outflows over the last two weeks—the group’s worst two-week stretch of the year.

The ETF universe experienced net outflows (-$9.2 billion) for the third week in four thanks to equity ETFs. Equity ETFs (-$10.0 billion) were responsible for all of the net outflows as taxable bond and muni debt ETFs took in $697 million and $19 million in net new money, respectively. For the second week in a row, SPDR S&P 500 ETF (SPY, -$6.0 billion) was responsible for more than half of the net outflows for equity ETFs, while for the taxable bond ETF group the largest individual net inflows belonged to iShares Core U.S. Aggregate Bond ETF (AGG, +$852 million) and iShares U.S. Treasury Bond ETF (GOVT, +$348 million).

As depicted in the chart above, the S&P 500 (top chart) and 4-week Equity flows (bottom chart), it’s rather remarkable that the S&P 500 continues to hover near all-time highs.
While fund flows continue to prove a negative underlying variable for future market gains, it is important to reflect on the fact that corporate buybacks have offset such outflows year-to-date. Coupled with short covering and light releveraging, the market has and can continue to achieve record levels in the medium to long-term.
Moreover, should the trade feud find near-term resolution, outflows could turn quickly in favor of greater equity ETF inflows and with a return of the multinational stocks. Multinationals have been underperforming the broader market, as the stronger U.S. Dollar and trade feud have proven longstanding. But with this as a backdrop, famed economist Ed Yardeni is of the opinion that these stocks could provide the much-needed fuel to recapture the highs and then some.
“I think it moves higher partly because there’s a recognition that even companies that do business with China are going to find ways to deal with this escalating trade tension like moving some of their supply chains to other countries.

This trade escalation is probably going to be more of a negative for China than it is for the United States. They desperately need a deal much more so than we do.” I think a deal will be struck and probably by the end of this summer, if not before then.”
Yardeni still predicts the S&P 500 will end the year at 3,100, and his 2020 forecast take the index to 3,500, a 22% gain from Friday’s close.
As Yardeni models for the benefit of multinationals coming back into play with a trade resolution by the summer, J.P. Morgan Chase’s Marko Kolanovic also models the quant team’s S&P 500 target for 2019 as follows:
“We think that the Trump put is 3-4% out of the money, and would kick in well before the ‘Fed put’ (which is likely 10 - 15% out of the money). We maintain our (probability-weighted) year-end price target of 3000 for the S&P with an expectation that trade resolution would lead to markets moving significantly above (e.g. 3200), and a complete trade breakdown would lead to the market finishing significantly below our price target (e.g. 2550)."
Earnings Outlook
The retail sector began their all-important reporting season last week, which will carry forward into the coming week. Macy’s (M) and Wal-Mart (WMT) were the key retail reports offered up this past week with their respective stocks going in opposite directions. Macy’s failed to deliver top-line growth and found its gross margins contracting by 80 bps, after falling 110 bps in the Q4 2018 period. While the bottom line number was a $.11 per share beat, investors were less optimistic about earnings given the demand side of the equation faltering.
Wal-Mart shares performed better as the stock benefitted from continued best-in-class online sales growth, topping the 34% growth by 3% from the same period a year ago. Having said that, much of the gains the gains in the share price have already evaporated alongside the broader market decline during the week.
We now have Q1 results from 459 S&P 500 members or 91.8% of the index’s total membership and the much heralded or feared earnings recession hasn’t taken place. According to Zack’s Research, total earnings for these 459 companies are up +0.2% from the same period last year on +4.7% higher revenues, with 76.9% beating EPS estimates and 59.3% beating revenue estimates.

The moderation in this year’s growth also reflects the deceleration in global economic growth. The global GDP growth picture appears to have stabilized and even started improving in China and some other parts, but the pace is nevertheless expected to be below what we experienced in the last two years.
Second, driving the earnings growth challenge is widespread margin pressures across all major sectors. Net margins for the 459 index members that have reported results are 11.7%, which compares to 12.2% for the same group of index members in the year-earlier period, as you can see in the comparison chart below:

A significant reason for this margin pressure is the tough comparisons to last year when margins got a big boost from the tax-cut legislation. Cyclical factors are also at play. Many companies on earnings calls with analysts have been complaining about rising material and payroll costs. Additionally, the strong U.S. Dollar has weighed on margins, although investors have largely looked past this issue.
FactSet has yet to update their respective Q1 2019 blended earnings results and outlook, as such we turn our attention to Reuters/Lipper/Refinitiv’s Q1 2019 earnings outlook.
Aggregate Estimates and Revisions
- First quarter earnings are expected to increase 1.4% from 18Q1. Excluding the energy sector, the earnings growth estimate is 2.8%.
- Of the 460 companies in the S&P 500 that have reported earnings to date for 19Q1, 75.2% have reported earnings above analyst expectations. This compares to a long-term average of 65% and prior four-quarter average of 76%.
- 19Q1 revenue is expected to increase 5.6% from 18Q1. Excluding the energy sector, the growth estimate is 6.2%.
- 56.6% of companies have reported 19Q1 revenue above analyst expectations. This compares to a long-term average of 60% and prior four quarter average of 67%.
- The forward four-quarter (19Q2 –20Q1) P/E ratio for the S&P 500 is 16.7.
- During the week of May 20, 24 S&P 500 companies are expected to report earnings.
- The estimated earnings growth rate for the S&P 500 for 19Q2 is 1.1%. If the energy sector is excluded, the growth rate improves to 1.2%.

There are 2 key standouts with regards to Refinitiv’s latest earnings forecast and update. The Q1 2019 earnings outlook has risen from 1.3% a week ago to 1.4% this week. Secondly, while most forecast now suggest a Q2 2019 earnings recession of -1.5%, Refinitiv’s forecast shows earnings continuing to grow by 1.1% for the Q2 2019 period. Expectations for 2019 Q2 and the following quarters will evolve further, as the remaining companies report Q1 results and provide commentary about business conditions.
For the coming week, the following graphic identifies the key earnings reports set to be delivered:

Investor Takeaways
On the road to nowheresville this past week there were various twist and turns, highlighted by a litany of trade headlines to contend with. Certainly, this proved an uneasy week in the markets for investors and economists alike. Parsing through the earnings while projecting the effects of the trade feud is a daunting task. My outlook remains with an H2 2019 recovery in earnings but is stressed due to the escalation in the trade feud. As such, I continue to monitor the weekly headlines and update our forecast accordingly.
For the trading week to come, investors should continue to remain active and nimble should the attempt to trade the swings in the marketplace. While certain aspects of global trade have subsided, others remain without resolution and highly relevant. We anticipate continued trade headlines, as this week will culminate with a scheduled trip from President Donald Trump to Japan and with the presumption of a trade deal coming from the two parties. If such a deal commences, it will improve global trading conditions and by all accounts, it appears as though Japan desires such an outcome.
Japan has agreed to lift longstanding restrictions on American beef exports, clearing the way for U.S. products to enter the market regardless of age, the U.S. Department of Agriculture announced Friday. The U.S. is Japan’s largest beef supplier in terms of value and ranks second behind Australia in volume.

You’ve likely already heard that China has been reducing their U.S. debt holdings. This is actually a process that has been in place for several years now. According to the U.S. Treasury, China has cut its holding of U.S. Treasury securities to a 22-month low, potentially in retaliation as the trade dispute lingers. What isn’t discussed as much, though, is that global demand for U.S. debt remains strong, with foreign ownership of U.S. debt hitting a record high last month.

Depicted in the chart above (LPL Financial), while China has been decreasing how much U.S. debt it holds, Japan has silently increased its holdings for five consecutive months. Someone wants a trade deal!
Undoubtedly, the week that lay ahead remains with its forecasting complexities. The short term is mixed right now, offering no clear risk/reward advantage in either direction. Trade war news adds extra uncertainty. The short term is always extremely hard to predict, no matter how much conviction you think you have. Too many exogenous factors impact the short term, as we have seen over the last few weeks. Given the aforementioned, investors should focus on essential, actionable information and avoid information that is sensational, bombastic, or lacking in evidence. We can debunk a lot of market hyperbole or nonsense, but certainly, we can catch it all.
Comments
Log in or sign up to join the conversation.