

VALUATION WATCH: Overvalued stocks now make up 45.2% of our stocks assigned a valuation and 14.46% of those equities are calculated to be overvalued by 20% or more. Seven sectors are calculated to be overvalued.
Editor's Note: After this edition of our daily newsletter, we will be on a reduced publication schedule for the US Memorial Day holiday weekend. We will return to our normal schedule on Wednesday, June 1st. There will be no additional daily or weekly newsletters until then.
Indexing
--ValuEngine Rates and Ranks the DOW
We can use our data to track individual stocks, industries, sectors, and indices. For today's bulletin, we present key metrics for the top picks in the Dow Jones Industrials. The companies listed below represent the top stocks within the index. They are presented below according to their one-month forecast gain.
This time around, our top-three stocks remain unchanged. Traveler's Insurance remains the overall leader--as it has for several months. Verizon retains its second-place position and JNJ is third. Since the last time we presented the top Dow picks, JPMorgan and Home Depot have moved up a bit while United Health Care and McDonald's have declined. We have two new companies in our list: Microsoft and Cisco Systems. GE and Nike have fallen out of the top ten.
|
Ticker |
Company Name |
Market Price |
Valuation |
Last 12-M Retrn |
1-M Forecast Retn |
1-Yr Forecast Retn |
P/E Ratio |
Sector Name |
March 5, 2016 |
|
TRV |
TRAVELERS COS |
113.44 |
-0.73% |
10.43% |
1.10% |
13.22% |
10.70 |
Finance |
TRV |
|
VZ |
VERIZON COMM |
49.58 |
-4.71% |
-0.06% |
0.70% |
8.42% |
12.35 |
Utilities |
VZ |
|
JNJ |
JOHNSON & JOHNS |
112.69 |
4.40% |
11.19% |
0.64% |
7.70% |
17.87 |
Medical |
JNJ |
|
JPM |
JPMORGAN CHASE |
64.54 |
8.53% |
-2.90% |
0.52% |
6.23% |
11.70 |
Finance |
UNH |
|
UNH |
UNITEDHEALTH GP |
132.59 |
5.28% |
10.87% |
0.49% |
5.86% |
20.14 |
Medical |
NKE |
|
HD |
HOME DEPOT |
133.36 |
3.80% |
18.90% |
0.49% |
5.85% |
23.52 |
Retail-Wholesale |
MCD |
|
MCD |
MCDONALDS CORP |
123.95 |
23.14% |
25.21% |
0.49% |
5.81% |
23.78 |
Retail-Wholesale |
JPM |
|
CSCO |
CISCO SYSTEMS |
28.47 |
0.41% |
-2.70% |
0.47% |
5.68% |
13.62 |
Computer and Technology |
HD |
|
PFE |
PFIZER INC |
34.1 |
6.18% |
-0.53% |
0.47% |
5.66% |
14.31 |
Medical |
PFE |
|
MSFT |
MICROSOFT CORP |
51.59 |
29.41% |
10.00% |
0.44% |
5.26% |
19.25 |
Computer and Technology |
GE |
NOTE: New stocks are in BOLD.
NOTE ALSO: Cisco Systems, Pfizer, and Microsoft are not currently rated a "BUY."
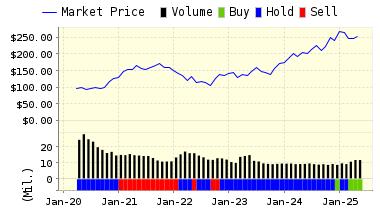
Below is today's data on JPMorgan Chase (JPM):
JPMorgan Chase & Co. is a financial services firm. The Company is engaged in investment banking, financial services for consumers and small businesses, commercial banking, financial transaction processing, asset management and private equity. It offers various investment banking products and services, including advising on corporate strategy and structure, capital-raising in equity and debt markets, risk management, market-making in cash securities and derivative instruments, prime brokerage. It also offers consumer and business, and mortgage banking products and services that include checking and savings accounts, mortgages, home equity and business loans, and investments. JPMorgan Chase & Co. is headquartered in New York.
VALUENGINE RECOMMENDATION: ValuEngine continues its BUY recommendation on JPMORGAN CHASE for 2016-05-24. Based on the information we have gathered and our resulting research, we feel that JPMORGAN CHASE has the probability to OUTPERFORM average market performance for the next year. The company exhibits ATTRACTIVE Company Size and P/E Ratio.
|
ValuEngine Forecast |
||
|
Target |
Expected |
|
|---|---|---|
|
1-Month |
64.88 | 0.52% |
|
3-Month |
66.62 | 3.23% |
|
6-Month |
68.80 | 6.59% |
|
1-Year |
68.56 | 6.23% |
|
2-Year |
78.81 | 22.11% |
|
3-Year |
80.53 | 24.78% |
|
Valuation & Rankings |
|||
|
Valuation |
8.53% overvalued |
Valuation Rank(?) |
 29 29 |
|
1-M Forecast Return |
0.52% |
1-M Forecast Return Rank |
85 |
|
12-M Return |
-2.90% |
Momentum Rank(?) |
63 |
|
Sharpe Ratio |
0.24 |
Sharpe Ratio Rank(?) |
74 |
|
5-Y Avg Annual Return |
6.51% |
5-Y Avg Annual Rtn Rank |
75 |
|
Volatility |
27.23% |
Volatility Rank(?) |
63 |
|
Expected EPS Growth |
7.67% |
EPS Growth Rank(?) |
39 |
|
Market Cap (billions) |
241.26 |
Size Rank |
100 |
|
Trailing P/E Ratio |
11.70 |
Trailing P/E Rank(?) |
85 |
|
Forward P/E Ratio |
10.87 |
Forward P/E Ratio Rank |
77 |
|
PEG Ratio |
1.52 |
PEG Ratio Rank |
31 |
|
Price/Sales |
2.40 |
Price/Sales Rank(?) |
37 |
|
Market/Book |
1.23 |
Market/Book Rank(?) |
68 |
|
Beta |
1.69 |
Beta Rank |
17 |
|
Alpha |
0.02 |
Alpha Rank |
69 |
ValuEngine Market Overview
|
Summary of VE Stock Universe |
|
|
Stocks Undervalued |
54.8% |
|
Stocks Overvalued |
45.2% |
|
Stocks Undervalued by 20% |
24.1% |
|
Stocks Overvalued by 20% |
14.46% |
ValuEngine Sector Overview
|
Sector |
Change |
MTD |
YTD |
Valuation |
Last 12-MReturn |
P/E Ratio |
|
1.99% |
-0.91% |
4.75% |
7.52% overvalued |
-1.61% |
23.92 |
|
|
1.72% |
-1.50% |
5.04% |
7.41% overvalued |
-2.85% |
22.54 |
|
|
2.69% |
-1.21% |
3.78% |
5.49% overvalued |
-9.85% |
17.28 |
|
|
2.50% |
-6.27% |
24.24% |
3.21% overvalued |
6.33% |
27.33 |
|
|
3.28% |
-1.35% |
4.45% |
3.07% overvalued |
-12.18% |
20.39 |
|
|
1.01% |
-0.53% |
-3.22% |
1.25% overvalued |
-6.17% |
18.90 |
|
|
1.63% |
-4.45% |
10.80% |
0.06% overvalued |
-37.27% |
22.55 |
|
|
3.29% |
-0.27% |
17.97% |
0.51% undervalued |
-6.89% |
20.83 |
|
|
2.24% |
0.25% |
1.40% |
1.05% undervalued |
-6.00% |
15.98 |
|
|
2.32% |
0.17% |
5.79% |
1.15% undervalued |
-10.30% |
26.94 |
|
|
2.91% |
0.81% |
9.44% |
2.26% undervalued |
-10.73% |
22.73 |
|
|
1.72% |
-1.25% |
0.92% |
4.56% undervalued |
-12.08% |
21.49 |
|
|
1.90% |
-2.17% |
-4.97% |
7.06% undervalued |
-20.49% |
27.40 |
|
|
2.40% |
-3.80% |
-2.77% |
7.53% undervalued |
-19.41% |
11.70 |
|
|
2.99% |
-4.82% |
-4.94% |
13.01% undervalued |
-16.96% |
21.19 |
|
|
1.89% |
-4.46% |
0.10% |
13.28% undervalued |
-29.59% |
13.11 |
ValuEngine.com is an independent research provider, producing buy/hold/sell recommendations, target price, and valuations on over 7,000 US and Canadian equities every trading day.
Comments
Log in or sign up to join the conversation.