
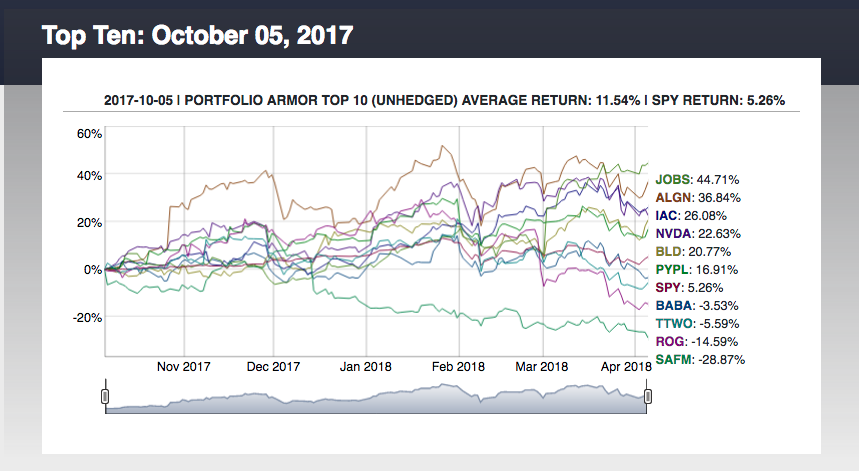
In a previous TalkMarkets post ("A Security Selection Method That Beats The Market"), I mentioned that, since June 8th, I've been posting Portfolio Armor's top ten names each week. These names are ranked based on my site's estimate of their potential returns over the next 6 months, net of hedging costs (each of these top names is hedgeable against declines as small as 9%). As of Thursday, we now have 6-month performance data for 18 weekly top names cohorts since then, with the October 5th cohort (pictured above), ending on April 5th.
The table below shows the performance of each of those 18 weekly cohorts. Clicking on a starting date will take you to an interactive chart for that cohort.
| Starting Date | Portfolio Armor 6-Month Performance | SPY 6-Month Performance |
|---|---|---|
| June 8, 2017 | 14.49% | 9.99% |
| June 15, 2017 | 19.85% | 10.97% |
| June 22, 2017 | 24.45% | 11.27% |
| June 29, 2017 | 18.24% | 11.68% |
| July 6, 2017 | 21.03% | 14.81% |
| July 13, 2017 | 28.25% | 14.85% |
| July 20, 2017 | 25.04% | 14.62% |
| July 27, 2017 | 33.52% | 17.10% |
| August 3, 2017 | 20.72% | 12.66% |
| August 10, 2017 | 13.05% | 8.36% |
| August 17, 2017 | 10.71% | 13.48% |
| August 24, 2017 | 15.23% | 13.72% |
| August 31, 2017 | 8.42% | 10.87% |
| September 7, 2017 | 12.75% | 11.61% |
| September 14, 2017 | 29.05% | 11.19% |
| September 21, 2017 | 22.56% | 9.42% |
| September 28, 2017 | 14.30% | 4.73% |
| October 5, 2017 | 11.53% | 5.26% |
| Average | 19.07% | 11.48% |
So Portfolio Armor's top ten names averaged 19.07% over the average of these 18 6-month periods, versus SPY's average of 11.48%, an average outperformance of 7.59% over 6 months.


Comments
Log in or sign up to join the conversation.