
06/07 FRIDAY | 12:30 GMT | CAD EMPLOYMENT CHANGE & UNEMPLOYMENT RATE (MAY)
Following the all-time best 106.5K jobs added in April, the May Canada jobs report looks to cool off a bit – not a surprise – by posting a small contraction of -5.5K jobs, according to a Bloomberg News survey. But the overarching strength of the Canada jobs market since the start of the year, compounded by gains in recent months, means that a small topline contraction shouldn’t impact the unemployment rate, due on hold at 5.7%.
OVERNIGHT INDEX SWAPS: BANK OF CANADA RATE EXPECTATIONS (JUNE 3, 2019) (TABLE 1)
(Click on image to enlarge)
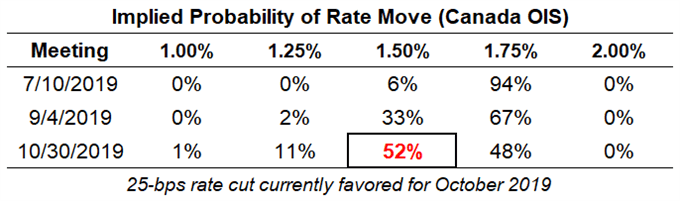
The strength seen in the Canadian labor market in recent months has helped keep rate cut expectations at bay. Two months ago, overnight index swaps were pricing in a 21% chance of a 25-bps rate cut by the end of September; now, those odds are higher at 33%. If there is going to be a 25-bps rate cut by the BOC in the next several months, overnight index swaps are favoring October 2019.
Pairs to Watch: CADJPY, EURCAD, USDCAD
USDCAD TECHNICAL ANALYSIS: DAILY PRICE CHART (DECEMBER 2018 TO APRIL 2019) (CHART 1)
(Click on image to enlarge)
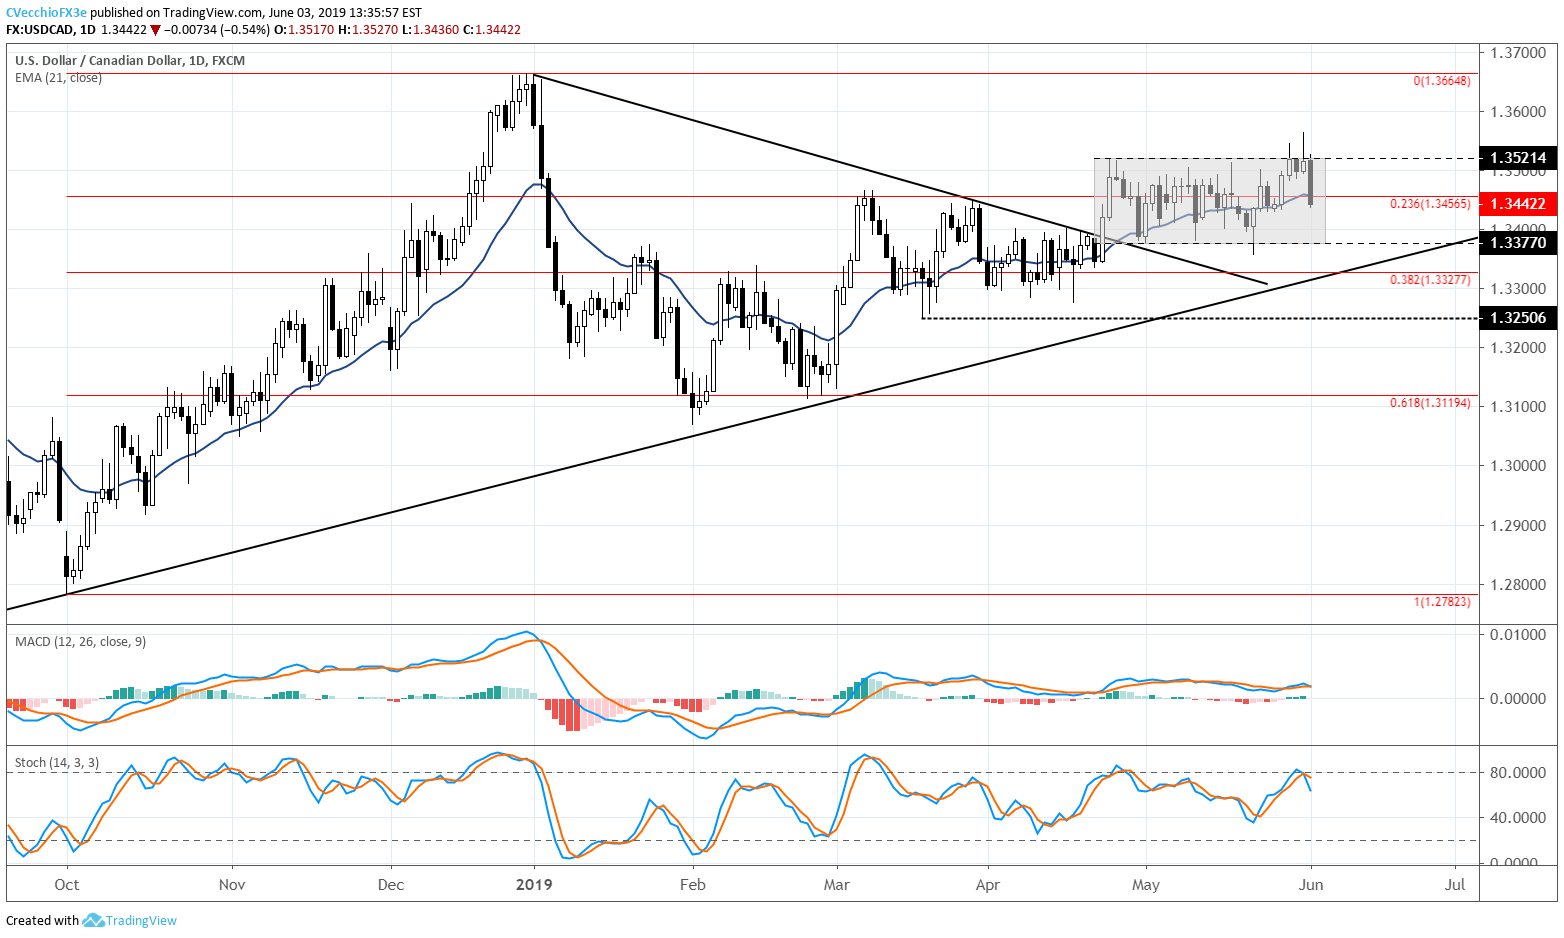
Against a backdrop of rapidly deteriorating crude oil prices, our most recent outlook for USDCAD prices had traders on alert for a potential bullish breakout condition. Since the close on April 23, USDCAD prices had closed every session between 1.3377 and 1.3521. But after three consecutive days in which USDCAD prices failed to clear topside resistance at 1.3521 on a closing basis, we’ve seen a sharp reversal back within the range at the start of this week.
If a false breakout condition has indeed developed in recent days, then USDCAD prices may well fully reverse back to the other side of the consolidation, which in turn would see prices return back to support around 1.3377. On a longer-term basis, if by the end of June we see that USDCAD is below 1.3377, this would constitute a downside break of the range as well as a break of the uptrend from February, March, and April 2019 swing lows.
IG CLIENT SENTIMENT INDEX: USDCAD (JUNE 3, 2019) (CHART 2)
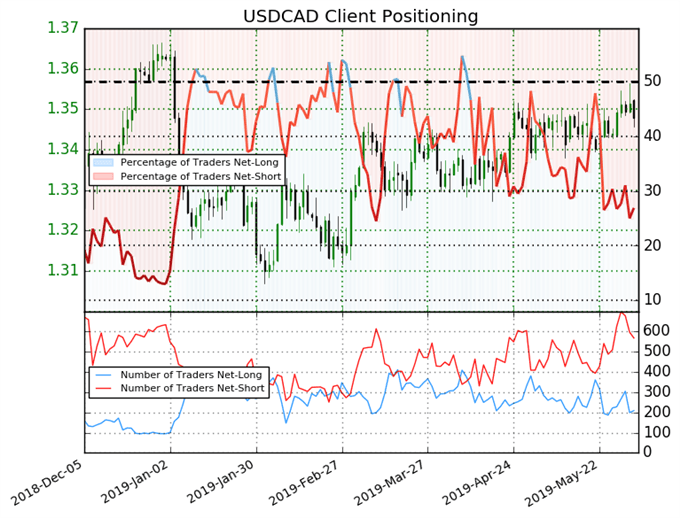
USDCAD: Retail trader data shows 26.9% of traders are net-long with the ratio of traders short to long at 2.72 to 1. In fact, traders have remained net-short since May 22 when USDCAD traded near 1.34019; price has moved 0.6% higher since then. The number of traders net-long is 7.2% higher than yesterday and 8.3% lower from last week, while the number of traders net-short is 10.6% lower than yesterday and 10.5% higher from last week.
We typically take a contrarian view to crowd sentiment, and the fact traders are net-short suggests USDCAD prices may continue to rise. Positioning is less net-short than yesterday but more net-short from last week. The combination of current sentiment and recent changes gives us a further mixed USDCAD trading bias.


Comments
Log in or sign up to join the conversation.