
News, geopolitical or financial, does not correlate consistently with market moves; sometimes, bad news has a positive effect, and good news a detrimental effect. News simply does not matter. The only consistent factor in the market is the emotion of fear...fear of losing...and fear of missing out (greed). That never changes. Human emotions leave repetitive patterns in the market's price history. In this piece we review the state of fear in the market.
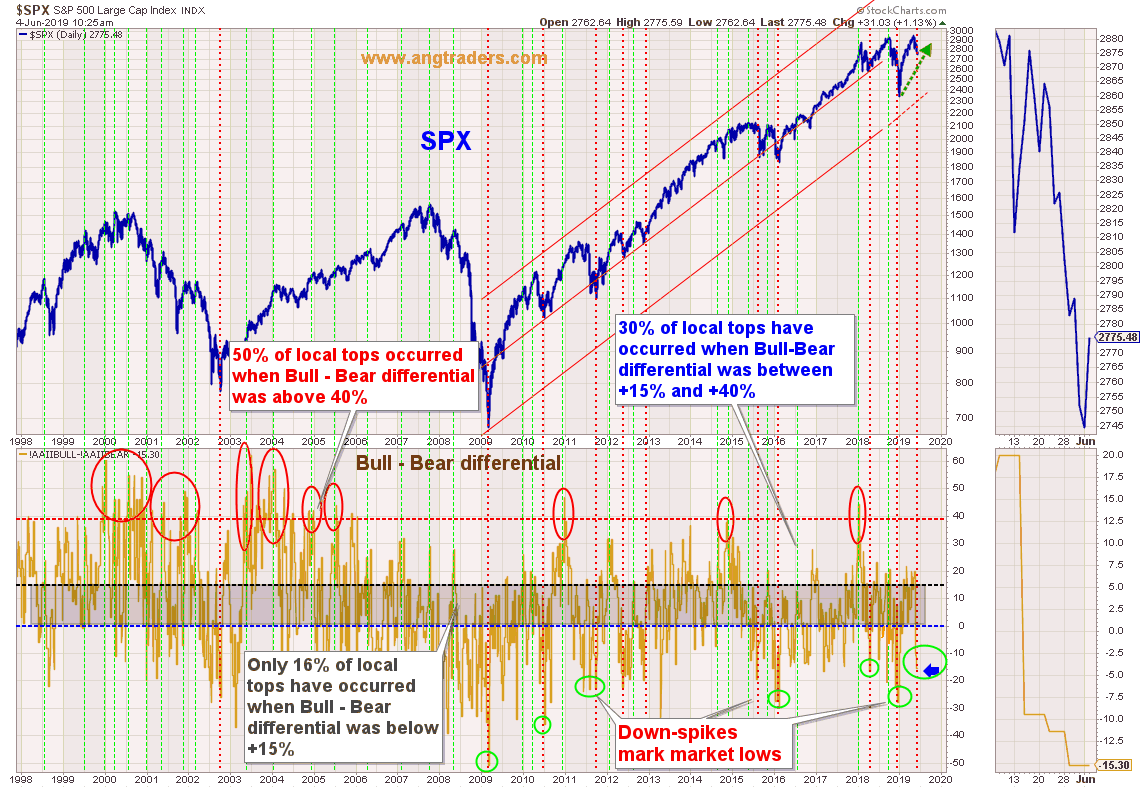
With the AAII sentiment survey at 24% bullish and the bear sentiment at 40%, there is little risk of a change to the market’s bullish primary trend. Most markets do not top out until the bull sentiment is above 50% and the bear sentiment is below 30%. Spikes above 30% in the bear sentiment correlate with minima in the S&P 500 (pink vertical lines on chart below).
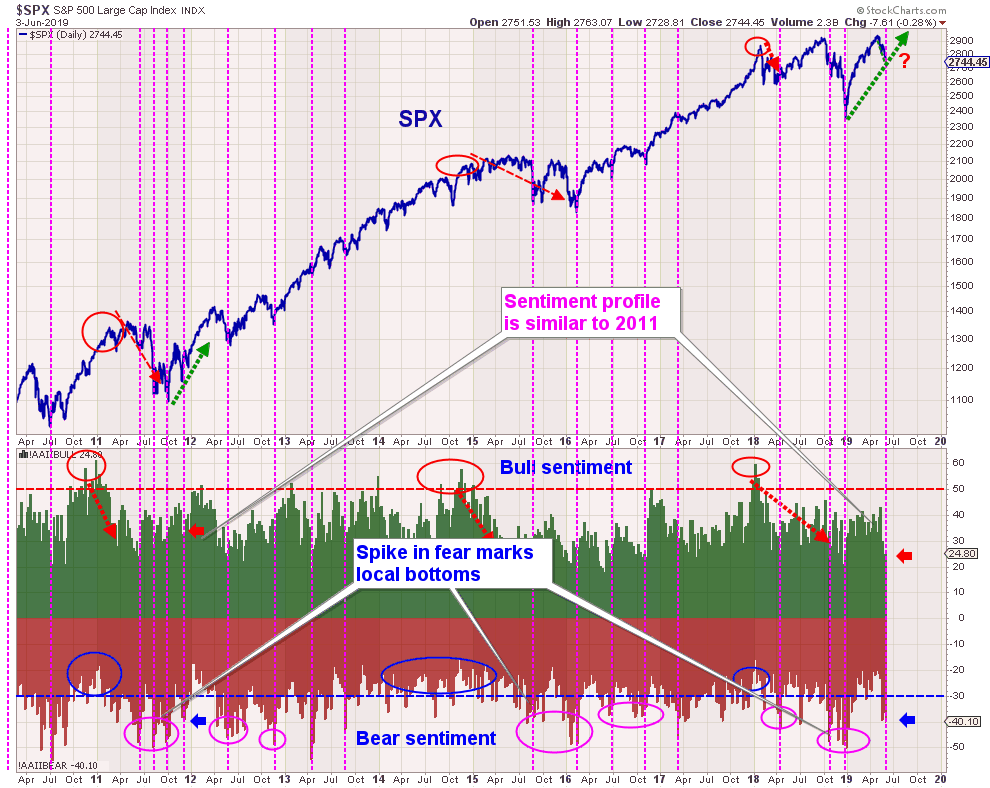
The bull-minus-bear sentiment differential has spiked down to -15.3% which is a level of fear that corresponds with market lows, not market tops (vertical red lines on chart below).
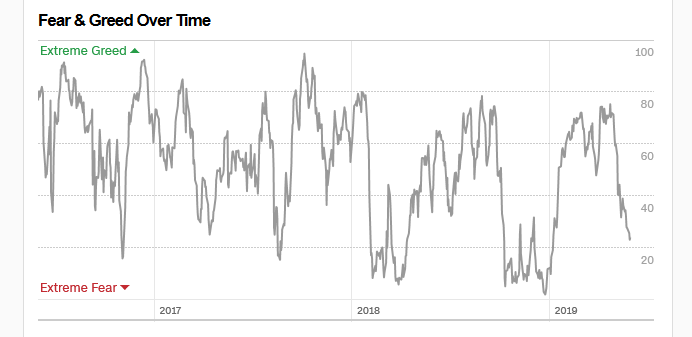
The CNN Fear & Greed Index has not been this fearful since early January of this year, just as it started to rally (table below).
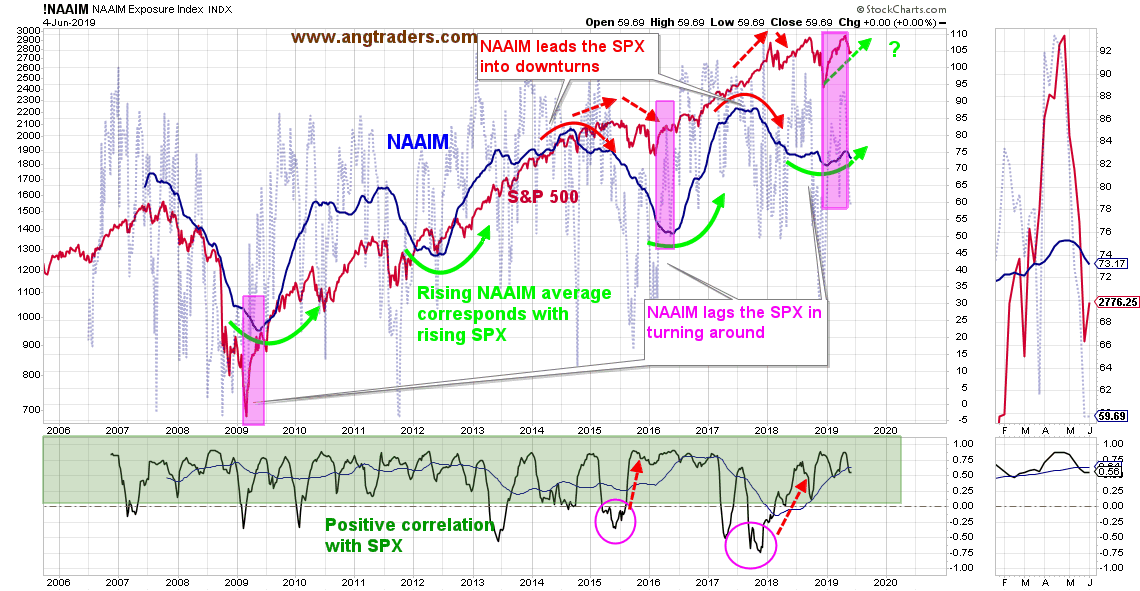
The National Association of Active Investment Managers (NAAIM) exposure index 50-week MA leads market down-turns and lags market up-turns; investment managers tend to be fearful even as a new rally is underway. The pattern is similar to the trading in 2009, 2012, and early 2016. Despite the drop in exposure, the 50-day MA continues to carve out a rounded bottom (chart below).
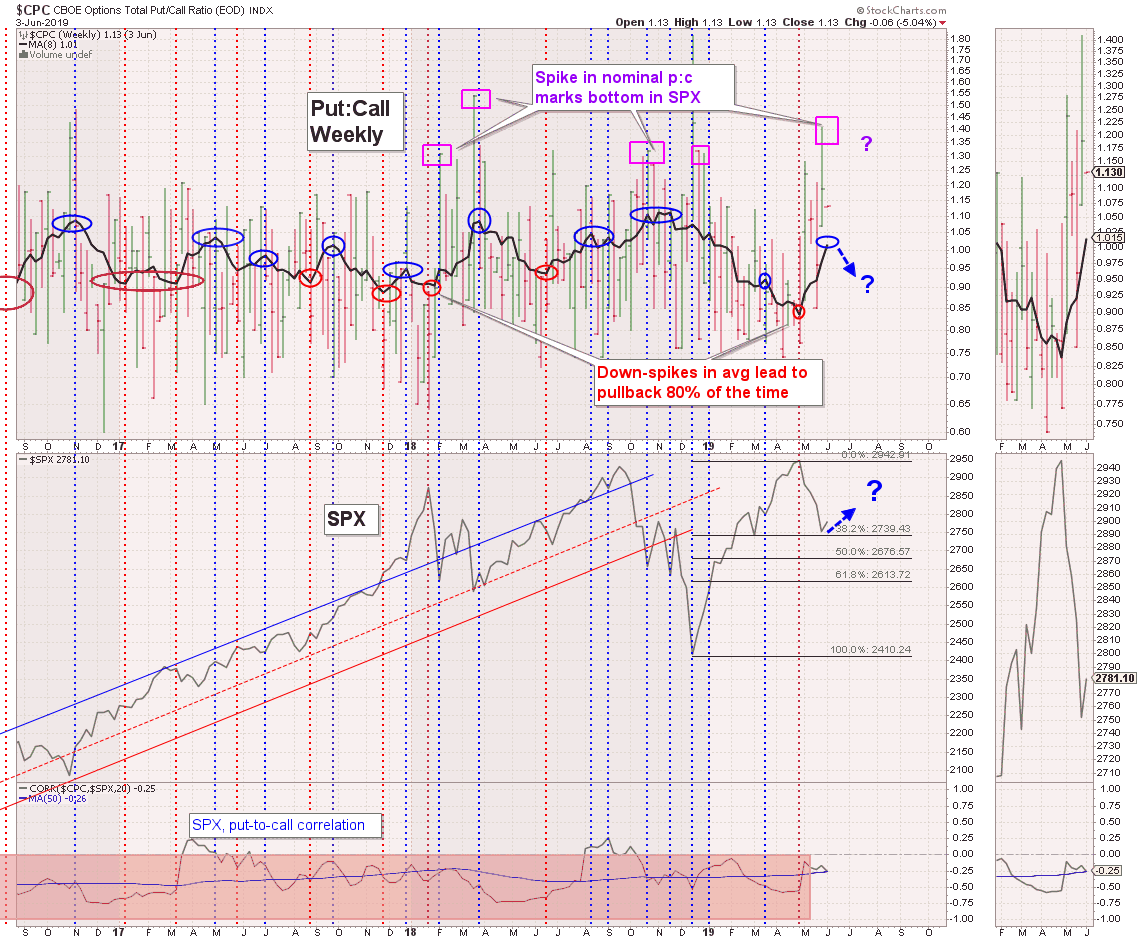
The nominal put:call ratio spikes up when fear overtakes traders. At 1.4, the ratio is the highest it has been since the S&P 500 low of March 2018, after which it went on to rally for another six months. This level of fear is likely to launch the SPX into a strong summer rally (chart below).
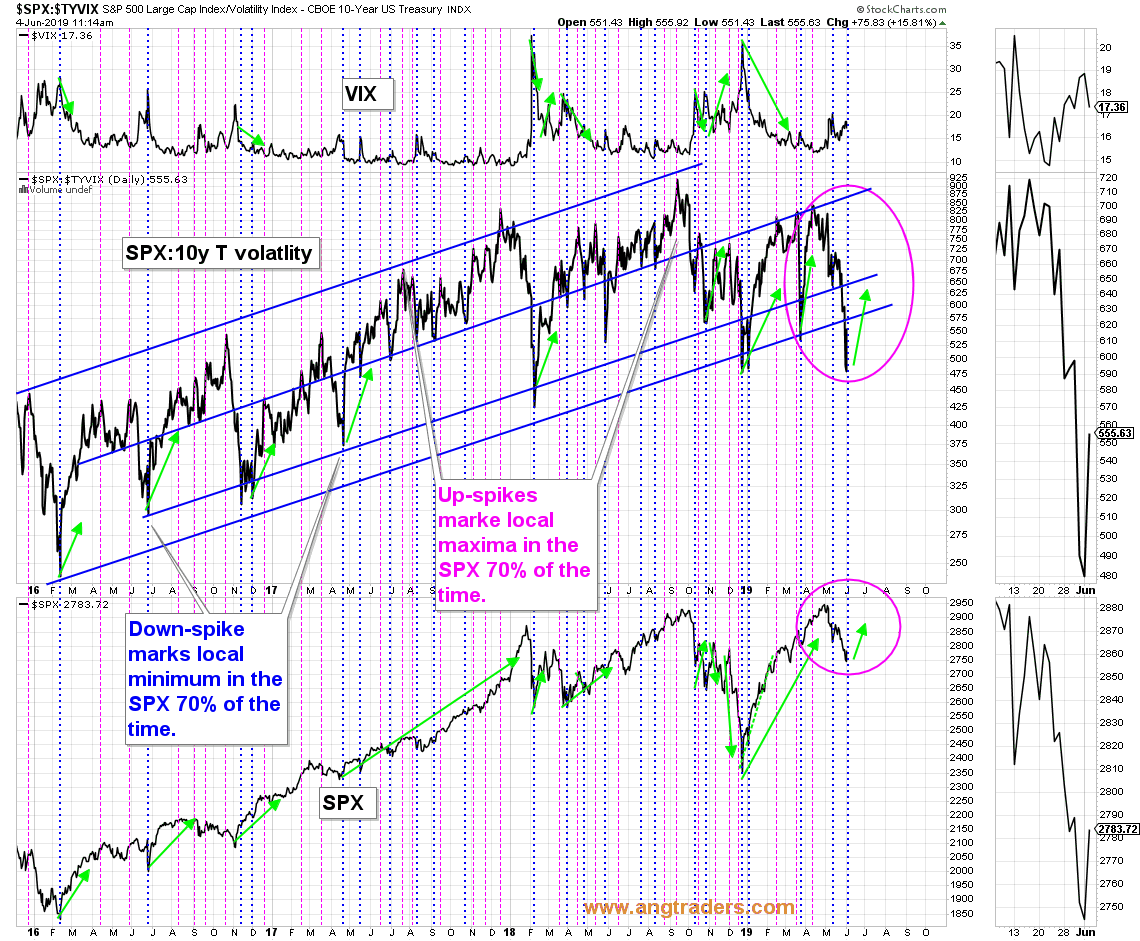
The ratio of the SPX to the volatility of the 10-y Treasury (SPX:10y T volatility) has a strong correlation to the SPX and is an indicator of fear in the market; Upspikes and downspikes in the ratio correspond to highs and lows, respectively, in the SPX 70% of the time. The current downspike implies extreme fear and a high probability that we are close to a local bottom in the SPX (vertical blue lines on chart below).
In conclusion, the various sentiment indicators are all demonstrating a level of fear that has correlated with market bottoms in the past and which, therefore, imply the formation of a market bottom in the present.


Comments
Log in or sign up to join the conversation.