
Today I used Barchart to find the stocks in the S&P 400 Mid Cap Index that had the best technical buy signals and charts. First I sorted the Index for the highest technical buy signals then used the Flipchart feature to find the charts I liked. This meant skipping a lot of charts.
Today's list includes Waddell and Reed Financial (WDR), Thor Industries (THI), Teleflex (TFX), SL Green Realty (SLG) and Raymond James Financial (RJF):
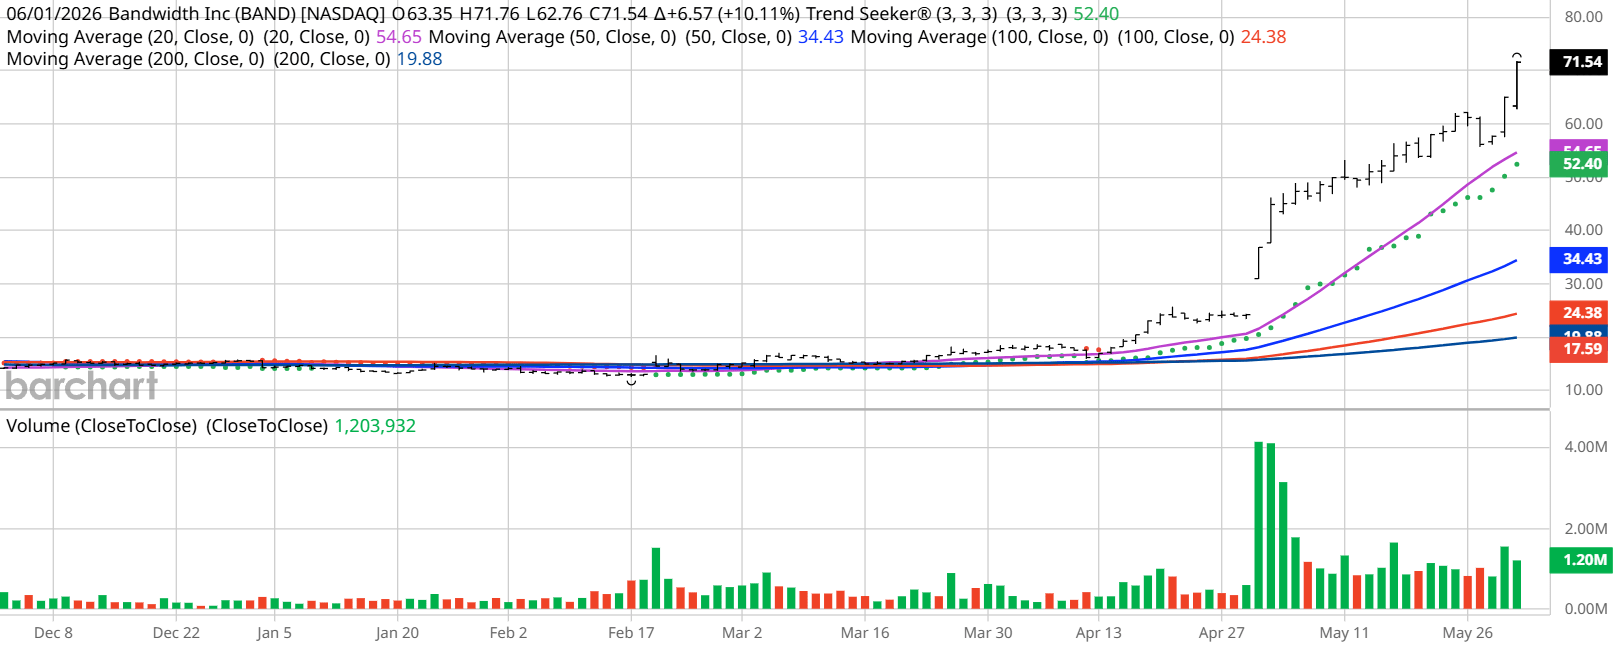
Waddell and Reed Financial (WDR)

Barchart technical indicators:
- 100% Barchart technical buy signals
- Trend Spotter buy signal
- Above its 20, 50 and 100 day moving averages
- 10 new highs and up 9.27% in the last month
- Relative Strength Index 68.45%
- Barchart computes a technical support level at 74.19
- Recently traded at 76.16 with a 50 day moving average of 69.42

Barchart technical indicators:
- 100% Barchart technical buy signals
- Trend Spotter buy signal
- Above its 20, 50 and 100 day moving averages
- 9 new highs and up 11.93% in the last month
- Relative Strength Index 68.73%
- Barchart computes a technical support level at 59.84
- Recently traded at 62.67 with a 50 day moving average of 56.17

Barchart technical indicators:
- 100% Barchart technical buy signal
- Trend Spotter buy signal
- Above its 20, 50 and 100 day moving averages
- 14 new highs and up 6.28% in the last month
- Relative Strength Index 75.77%
- Barchart computes a technical support level at 105.68
- Recently traded at 108.28 with a 50 day moving average of 99.62

Barchart technical indicators:
- 100% Barchart technical buy signals
- Trend Spotter buy signal
- Above its 20, 50 and 100 day moving averages
- 5 new highs and up 2.05% in the last month
- Relative Strength Index 62.24%
- Barchart computes a technical support level at 99.72
- Recently traded at 101.32 with a 50 day moving average of 97.07

Barchart technical indicators:
- 100% Barchart technical buy signals
- Trend Spotter buy signal
- Above its 20, 50 and 100 day moving averages
- 10 new highs and up 6.25% in the last month
- Relative Strength Index 66.70%
- Barchart computes a technical support level at 54.21
- Recently traded at 56.10 with a 50 day moving average of 52.38


Comments
Log in or sign up to join the conversation.