


Market vs. Replacement cost, and cyclically adjusted price to earnings ratio:
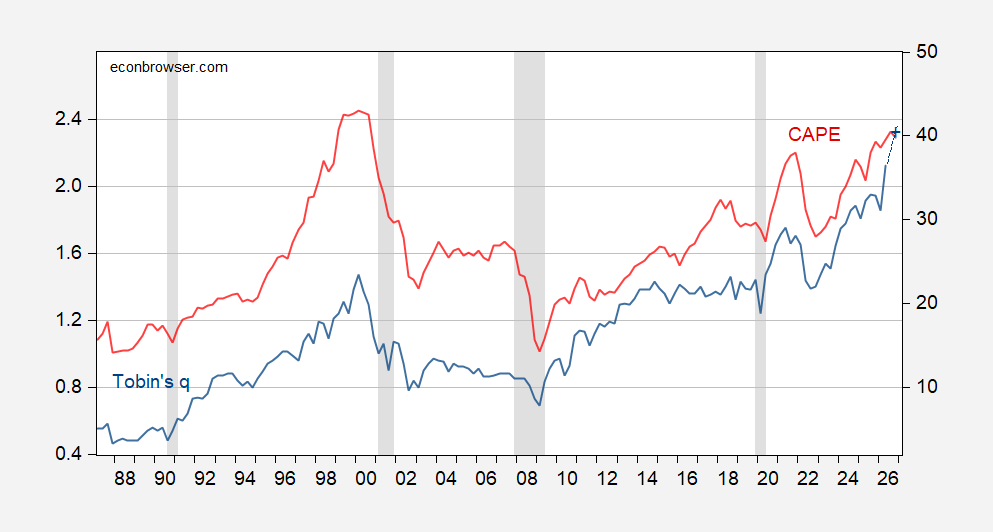
Figure 1: Tobin’s q (blue, left scale), Chang early Nov. estimate for q (blue +), Shiller’s Cyclically Adjusted Price Earnings ratio (red, right scale). Q4 CAPE is data through early November. NBER defined peak-to-trough recession dates shaded gray. Source: Y-Charts, Shiller, Chang/Advisor Perspectives, NBER.



Comments
Log in or sign up to join the conversation.