

Simply put the USD is the biggest digital currency, and it dwarfs bitcoin by several orders of magnitude. It seems that the Fed itself does not realize its own game.
Lets get into those digital currencies then!
THURSDAY'S RISK EVENTS
USD: Unemployment Claims, Chicago PMI, Personal Spending m/m.
EUR: German Retail Sales m/m, CPI Flash Estimate y/y
GBP: N/A.
JPY: N/A.
EUR/USD
30 min
4 Hours

Daily
My Bias: long-term bearish
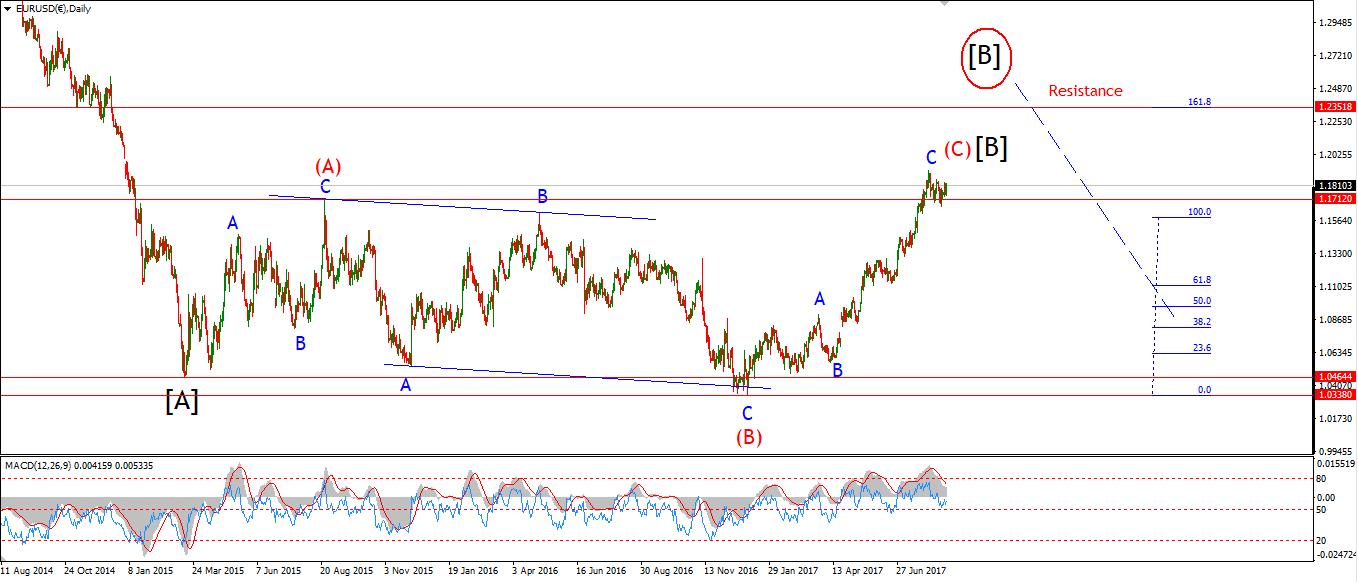
Wave Structure: downward impulse wave
Long-term wave count: lower in wave (3) red
The 4hr chart in EURUSD now shows a bearish momentum setup again, with RSI registering a momentum sell signal yesterday, and now MACD is on the verge of the same bearish downside cross.
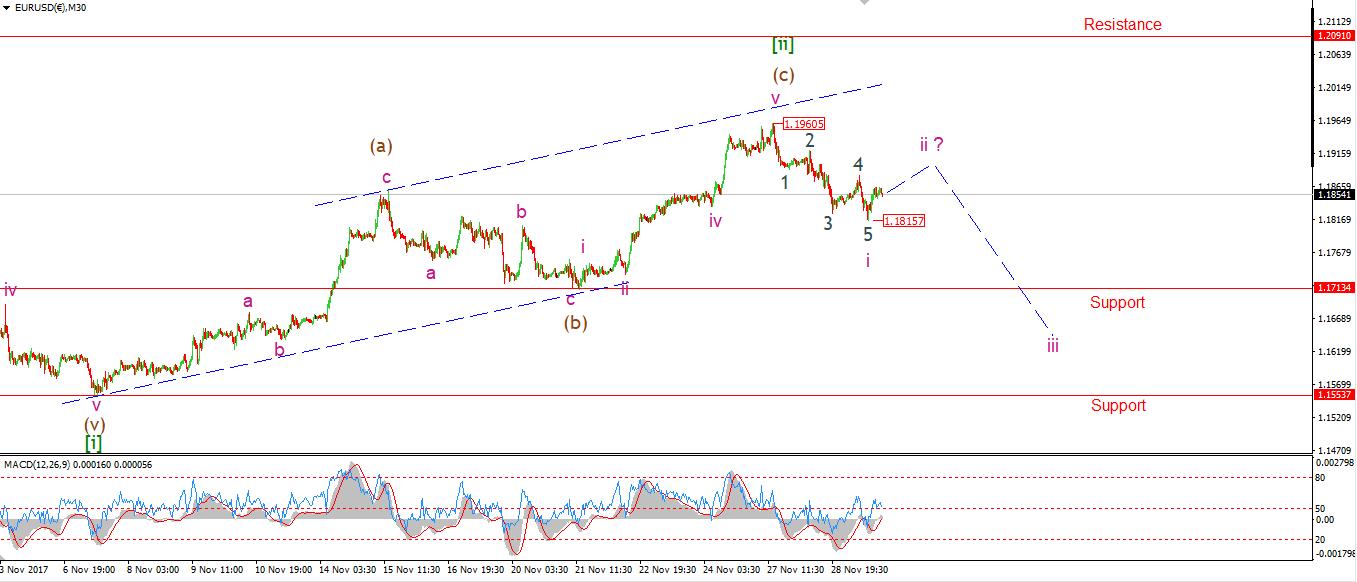
The short-term chart shows a possible 5 wave pattern to the downside in wave 'i' pink wave 'ii' should trade out a three wave rise, and is likely underway as I write.
The key level is now the low of wave 'i' at 1.1815. A break of that level again will signal a third wave decline in wave 'iii' pink. A large decline is now possible in the wave [iii] green.
For Thursday, watch for a corrective recovery in wave 'ii', to complete below 1.1960.
This will complete a bearish Elliott wave signal.
GBP/USD
30 min
4 Hours
Daily
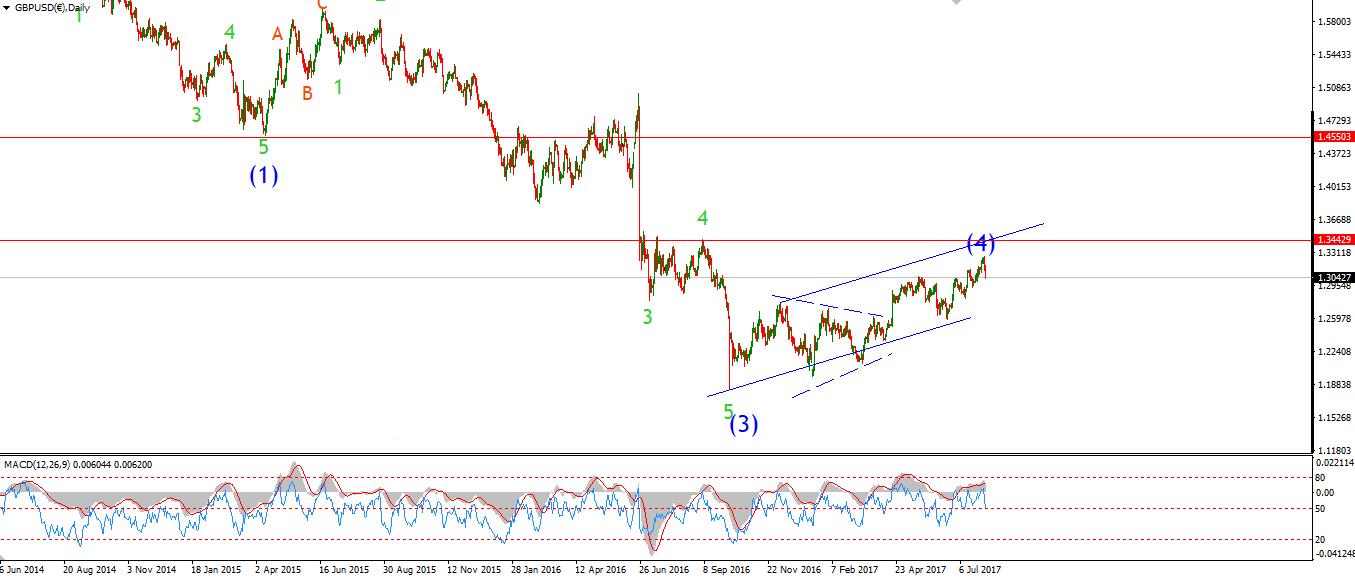
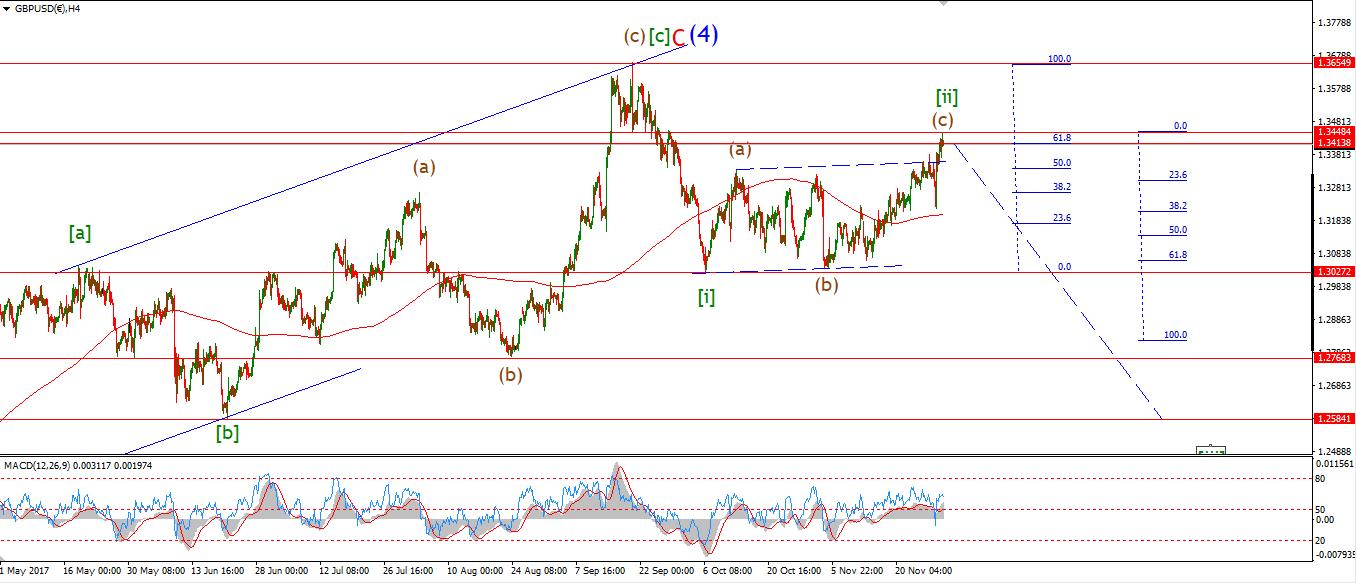
My Bias: short below parity in wave (5).
Wave Structure: continuing impulsive structure to the downside in wave (5)
Long-term wave count: decline in wave (5) blue, below parity
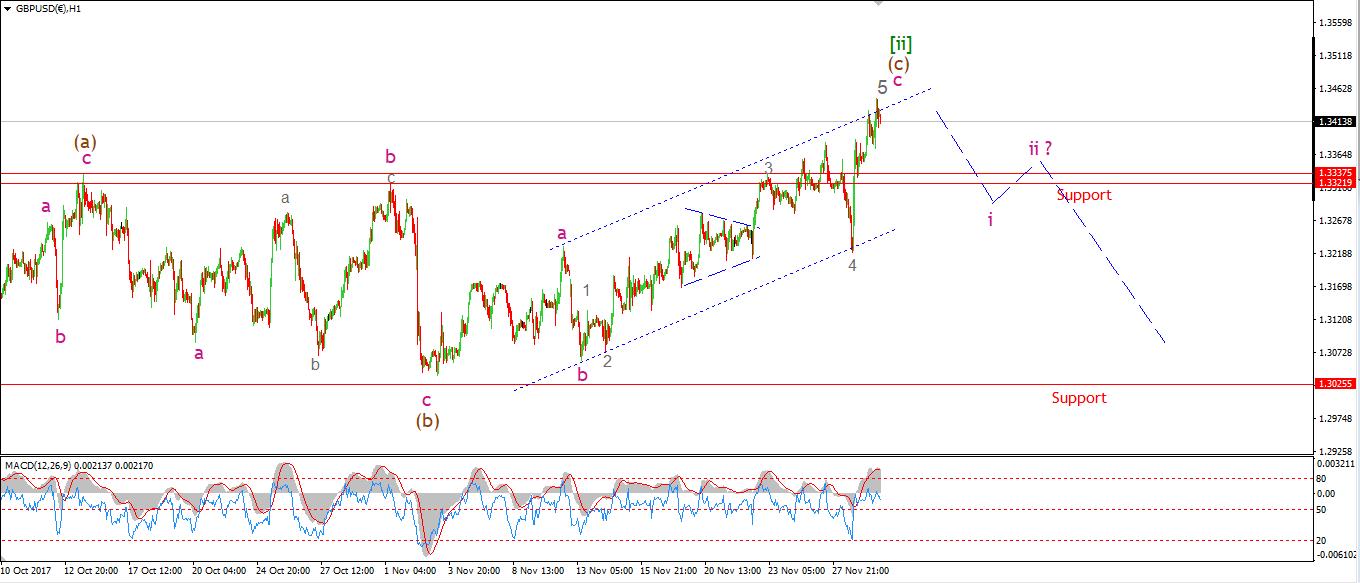
Cable is now sitting at the 61.8% retracement level of the previous wave [i] down. The price rise in wave (c) brown has exhausted its upside momentum in wave [ii].
At this point, it is time that the price turns back down into wave [iii] green. The initial target for wave [iii] green lies at 1.2400, given by the Fibonacci extension.
For Thursday, I am actively looking for an Elliott wave signal to the downside to form off the recent highs a break through support at 1.3320 should signal the turn into wave [iii].
USD/JPY
30 min
4 Hours

Daily
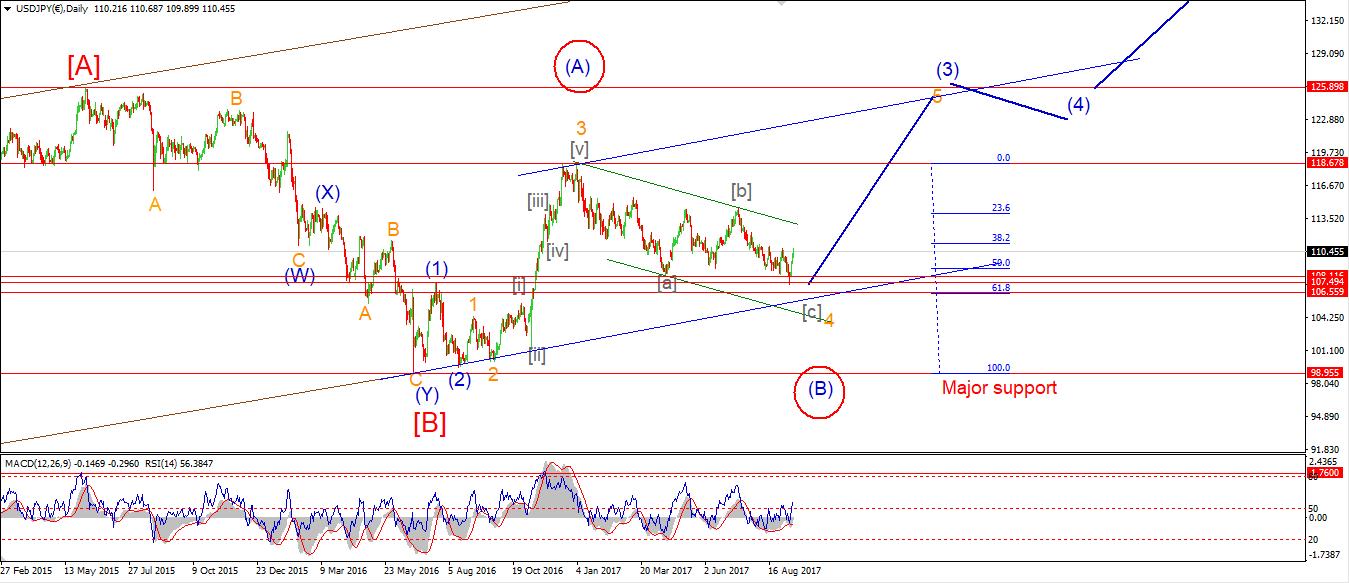
My Bias: LONG
Wave Structure: rally in wave [C]
Long-term wave count: wave [C] is underway, upside to above 136.00
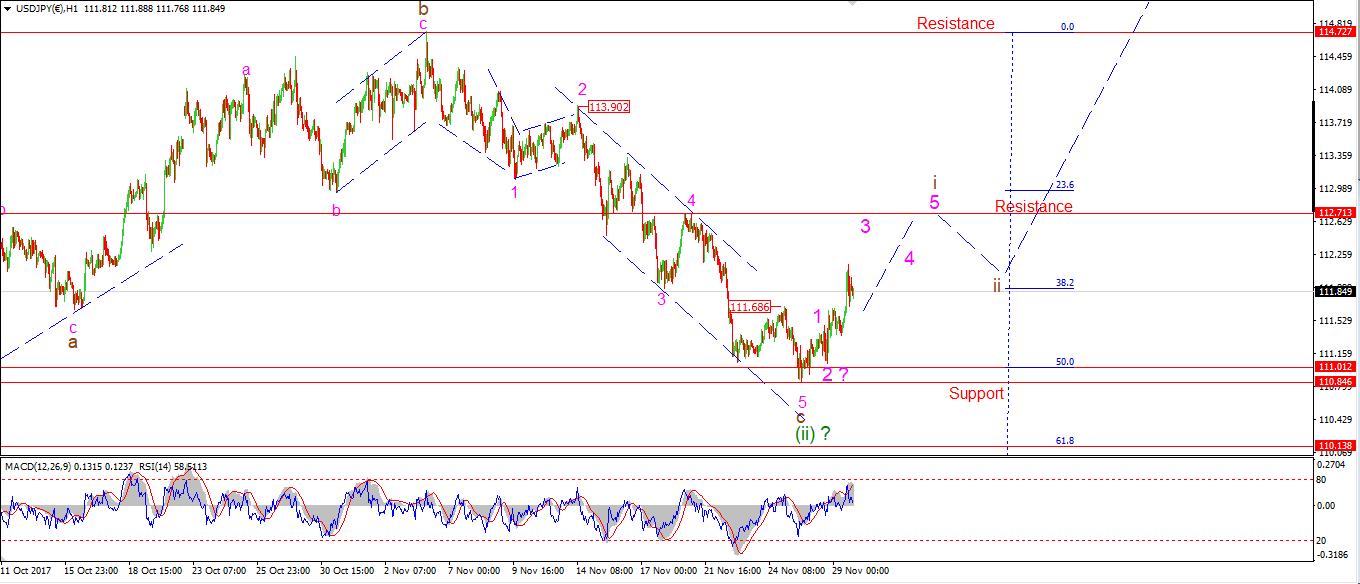
USDJPY has made an initial move off the lows in a possible developing five wave pattern to the upside.
A break above resistance at 112.71 will be the first bullish indicator.
The 4hr momentum setup is now fully bullish again, with a bullish centerline cross-registered in both RSI and MACD.
As with the other USD cross rates, the USD looks like it is about to strengthen against the yen also.



Comments
Log in or sign up to join the conversation.