
If last month we commented on the positive report for the future by OPEC, in which it estimated an increase of 1.4 million barrels per day for the next year 2022 by each member of the group, during the sessions of yesterday and today, OPEC and its allies are holding a meeting in search of an agreement in view of a possible increase in production during the coming months.
Initially, the OPEC+ meetings led by Russia and Saudi Arabia appear to show a modest increase in production that could reach 2 million barrels per day between the months of August and December. This meeting is very important because an insufficient agreement, or a very modest agreement, could harm the price in the short term by cutting the euphoria of the markets in the face of the increase in demand, since this could be insufficient.
After the positive report in June, the price of a barrel of Brent rose by 8.38% throughout the month, causing the price to stabilize at around $75 per barrel.
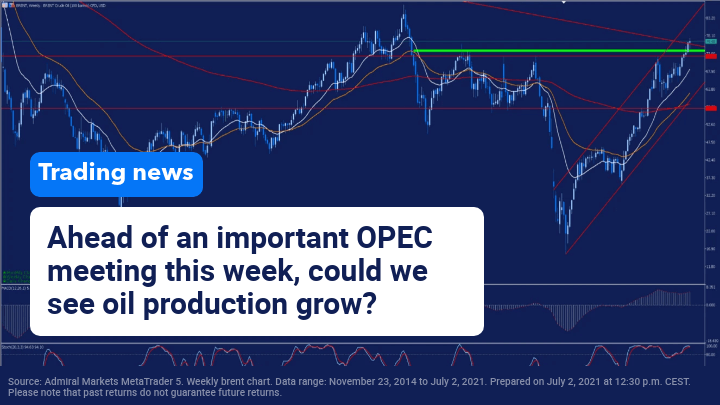
Technically speaking, if we look at the weekly chart, we can see how during this week the price has managed to overcome its important long downtrend line to the upside, so if this breakout is sustained over time, the price could experience a strong upward momentum that could take it in the first place to $80 per barrel or even to levels close to $87.
On the contrary, we can observe that the price is trading far from its moving averages and presents a strong overbought in its stochastic indicator, so we must also be attentive to a possible correction.
(Click on image to enlarge)

Source: Admiral Markets MetaTrader 5. Weekly brent chart. Data range: November 23, 2014 to July 2, 2021. Prepared on July 2, 2021 at 12:30 p.m. CEST. Please note that past returns do not guarantee future returns.
Evolution in the last 5 years:
- 2020: -21.52%
- 2019: 22.68%
- 2018: -19.55%
- 2017: 17.69%
- 2016: 52.41%


Comments
Log in or sign up to join the conversation.