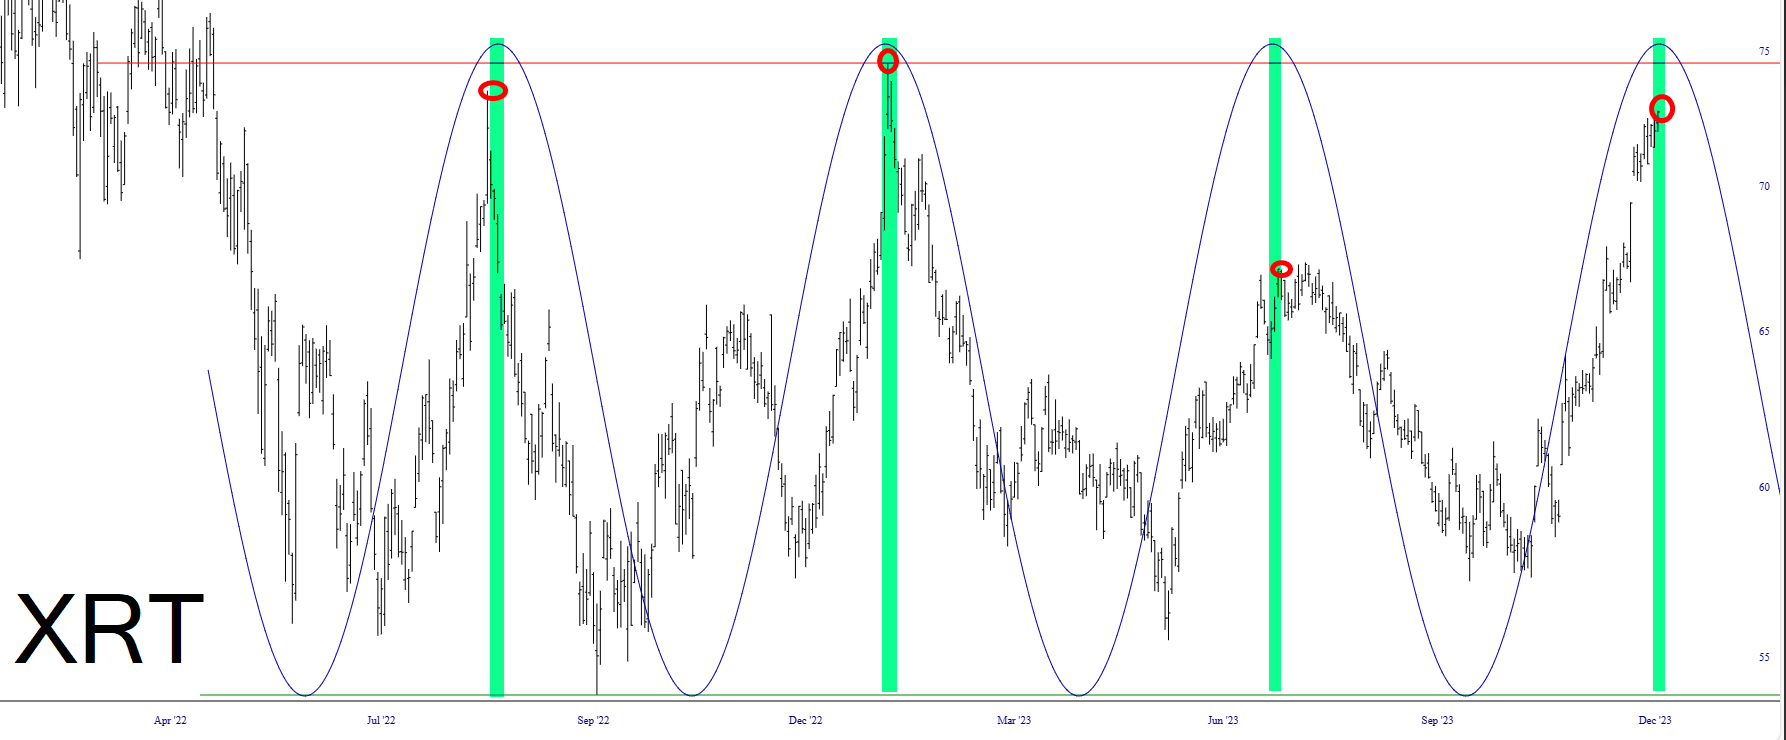


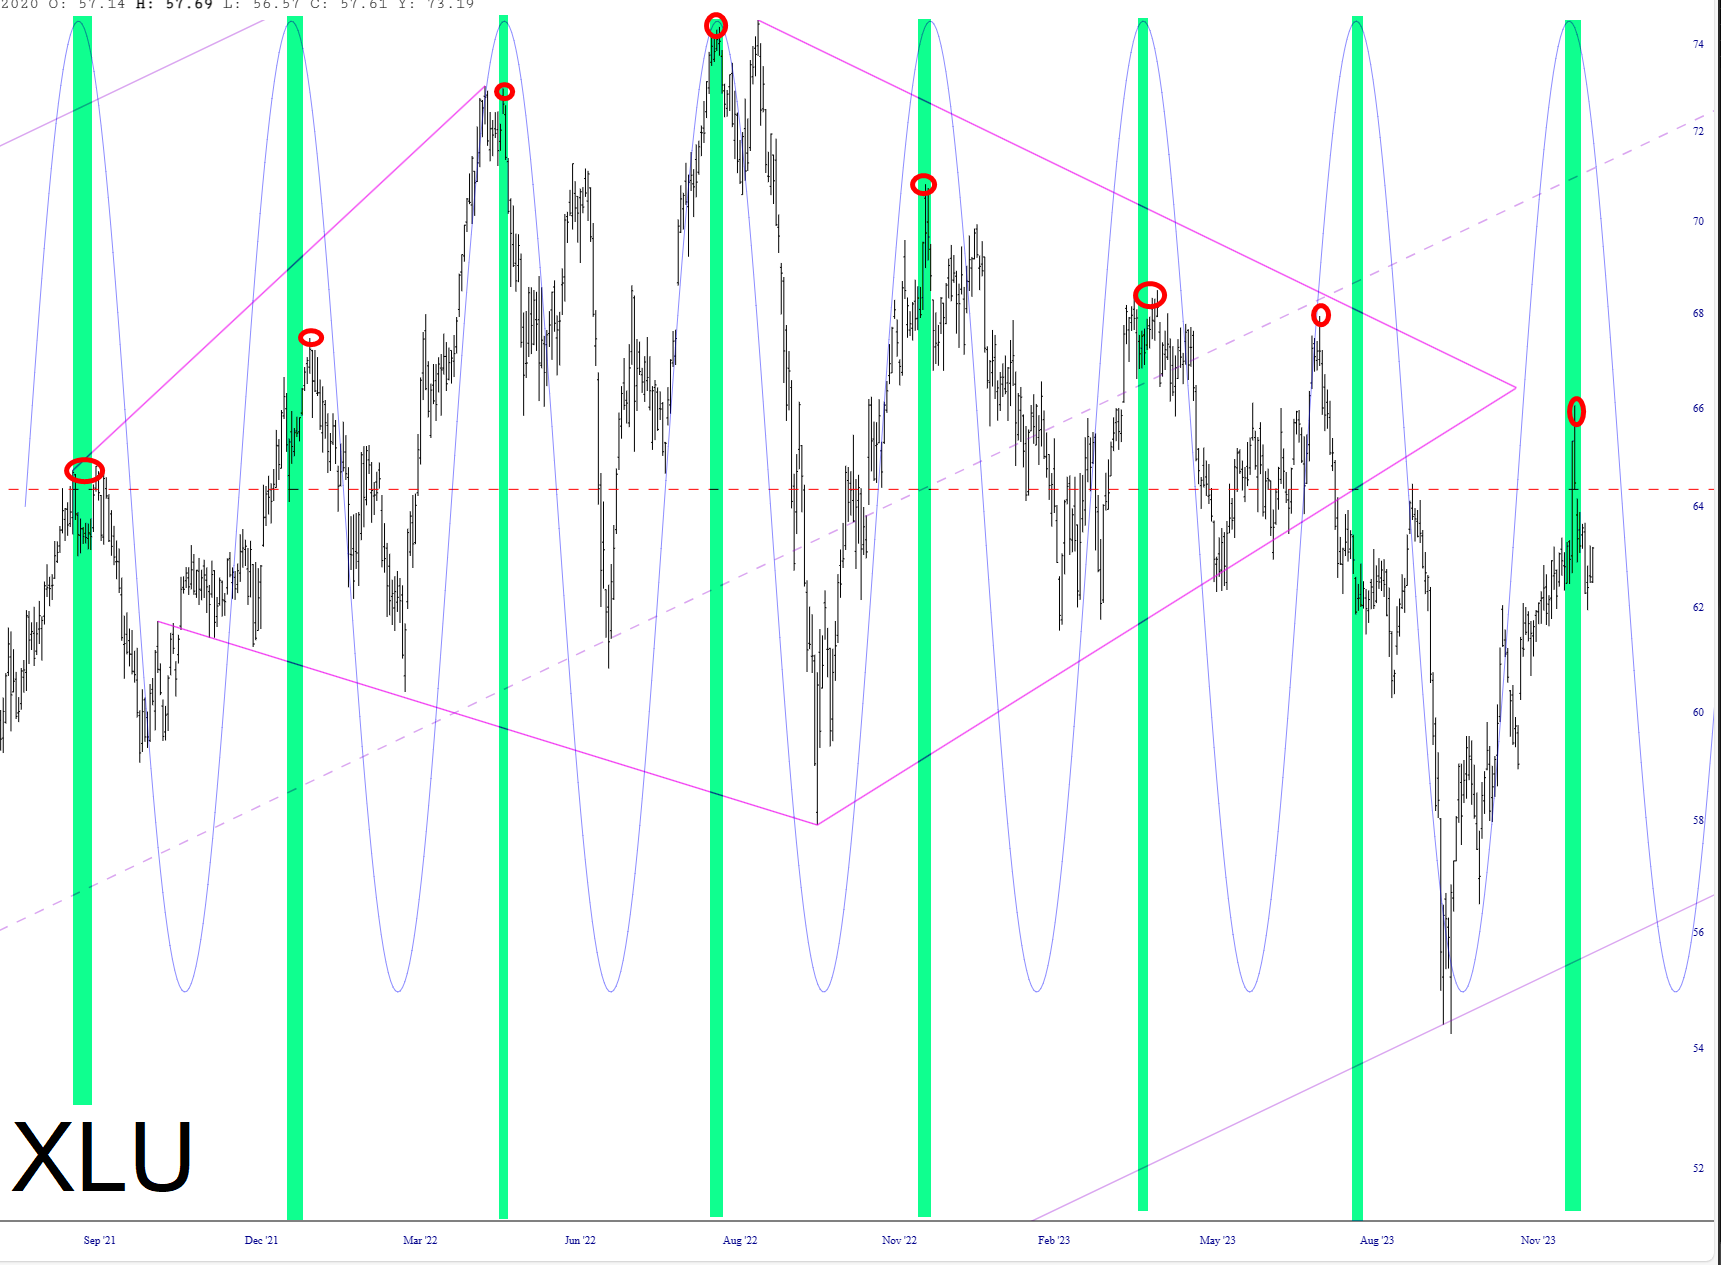
Assuming that, out of the blue, every single one of these doesn’t decide to break tradition! The green tints represent the PEAK of each sine wave, and the red circles represent the PEAK of each price pulse.
I tilt to the bearish side. Slope of Hope is not, and has never been, a provider of investment advice. So I take absolutely no responsibility for the losses – – or any credit for the gains – – you may or may not make from reading this forum. Whether you lose your life savings or make a fortune is entirely up to you and your own skills/luck/fate.
Comments
Log in or sign up to join the conversation.