

With US equity markets closed for Thanksgiving, the US dollar index (DXY) continues to hover around the $92 long-term support level this morning–its lowest point since May 2018.
A confluence of factors drives the benchmark currency one way and another, including trade and investment/speculative fund flows, hedging, fiscal and monetary interventions, relative global rates of interest, and economic growth. What happens to the dollar from here will impact everything on the opposite side of the teeter-totter. msfCase in point: just a .14% bounce in the DXY this morning, has the various cryptocurrencies plunging 10 to 20% each.
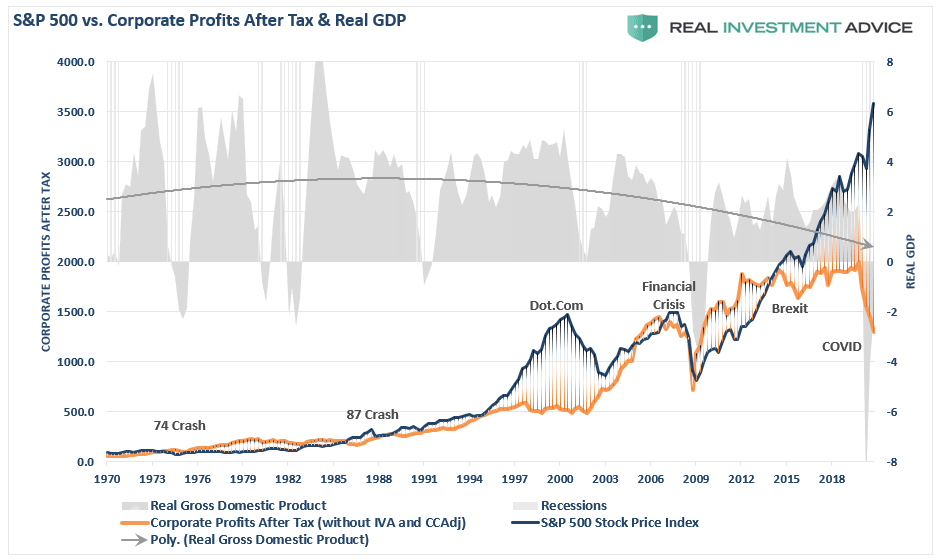
One thing for sure, the dollar is widely unloved while those bullish on risk assets has rarely if ever, been higher, even as the price of S&P 500 stocks (blue line below) has gone parabolic since March above crashing corporate profits (orange) and economic output (in grey).
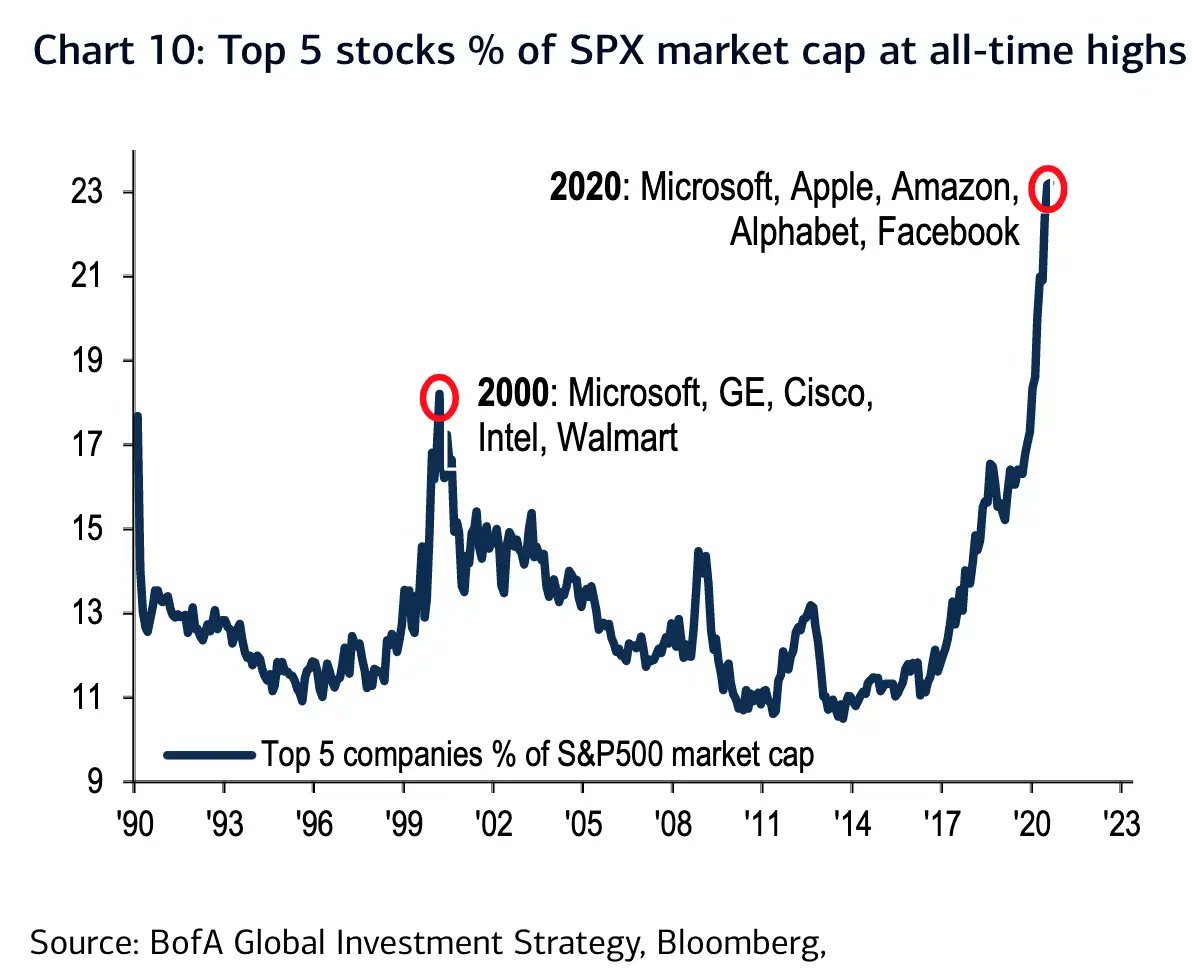
To-the-moon-explosions in the top 5 US tech stocks–Microsoft MSFT, Apple AAPL, Amazon AMZN, Alphabet GOOG GOOGL, Facebook FB, now more than 23% of the S&P 500’s market capitalization (price x shares)–have been a huge driving force in 2020. As shown beside, the top 5 most expensive market cap companies have now far surpassed the price overweight in even the top five at the 2000 tech bubble top. That’s some feat. Looks all very sustainable, doesn’t it?
(Click on image to enlarge)
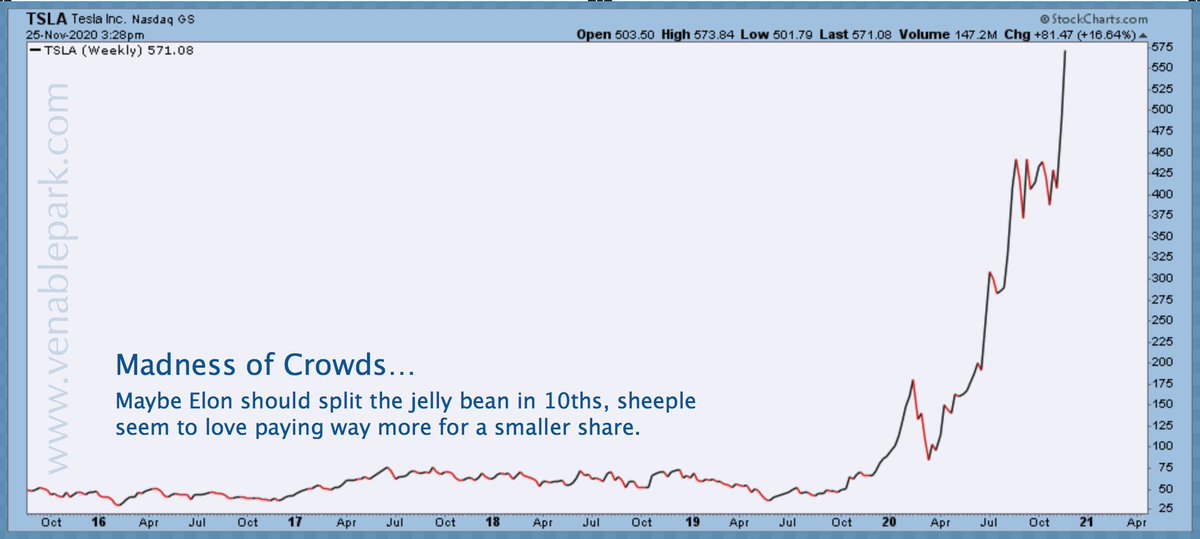
And then there is Tesla TSLA, of course! Its chart below says it all. Amazing cars, but how about that share price, eh? Tesla’s addition to the S&P 500 on December 21, will increase the price risk of S&P 500-tracking funds, ETFs, and portfolios everywhere, and will be loved only until the stock price inevitably succumbs to gravity. It’s still on planet earth after all.
(Click on image to enlarge)
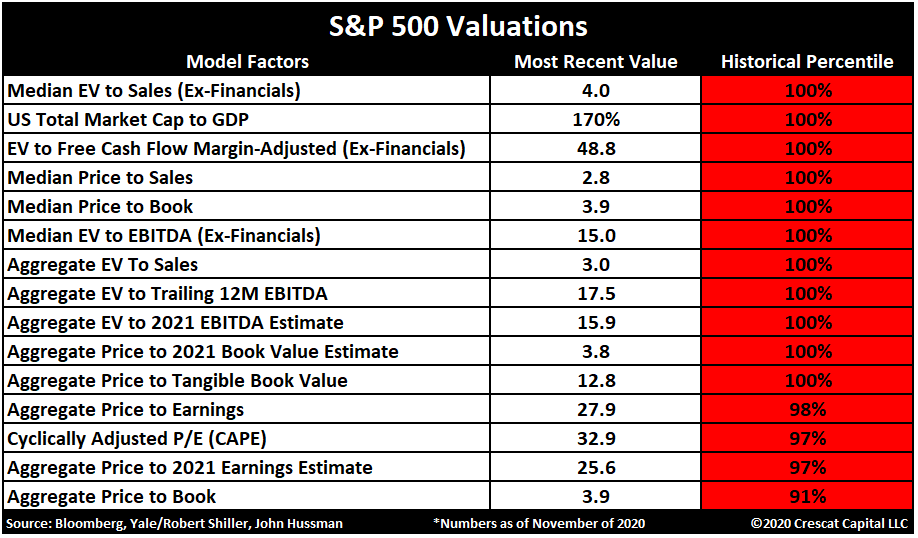
The table below courtesy of Crecat Capital summarizes the code-red warning on all historically reliable US stock valuation metrics now at, or near, the 100th percentile of all historical precedents. No worries here, right?
(Click on image to enlarge)
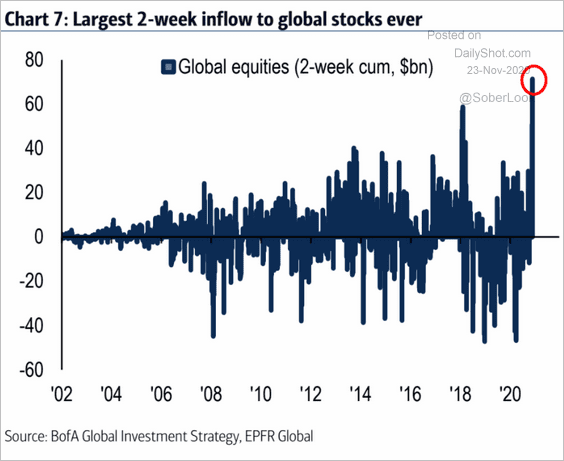
US stocks win the mania-pricing prize to be sure, but, in fairness, equities globally have seen record-breaking inflows in November, as shown below from DailyShot.com. This will continue so long as the dollar weakens/stock prices rise. Then liquidating flows will accelerate the decline in stock prices globally as happened in 2008 and every major sell-off that has happened since.
(Click on image to enlarge)
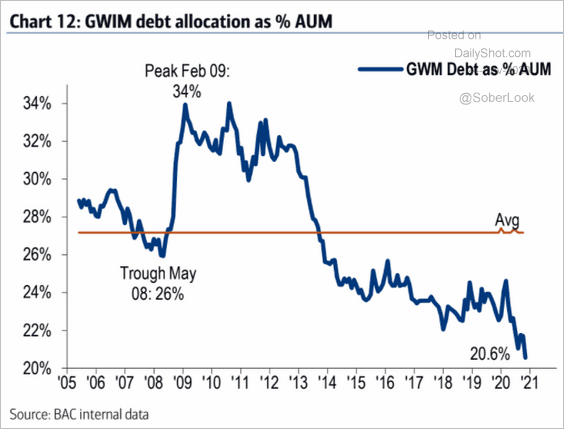
Assets that are unloved and drastically underweight in portfolios today are principal secure bonds and cash-like deposits. Low-risk is paying very little income, so do-it-yourselfers have joined global investment managers now holding the smallest weight as a percentage of total assets in at least 15 years (as shown below). Caution to the wind.
(Click on image to enlarge)
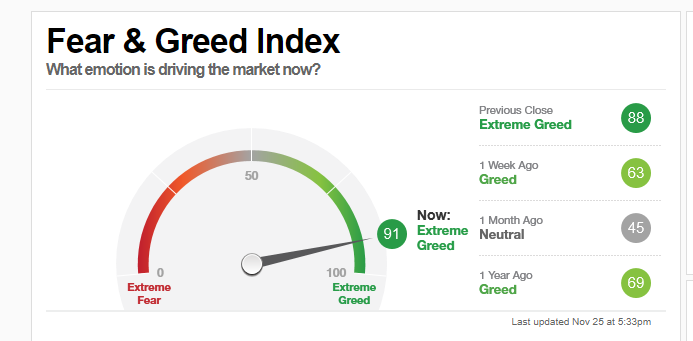
Greed was the dominant investor sentiment a year ago, but mid-way through a pandemic and the worst recession since the 1930s, desperation and government hand-outs are driving aggressive capital bets today. Consider, that most are heavily indebted while they are gambling.
The Fear & Greed Index in November (on left), courtesy of Helene Meisler should be sobering for thinking people.
(Click on image to enlarge)
The mania could last even longer or implode at every moment. This is where we are. Everyone should be informed of the conditions at hand.
Best wishes to all; may you have peace for the holidays.

Comments
Log in or sign up to join the conversation.