
Forecasters Hold the Line on Projections for Growth While Cutting Their Projections for Unemployment
by Philadelphia Fed
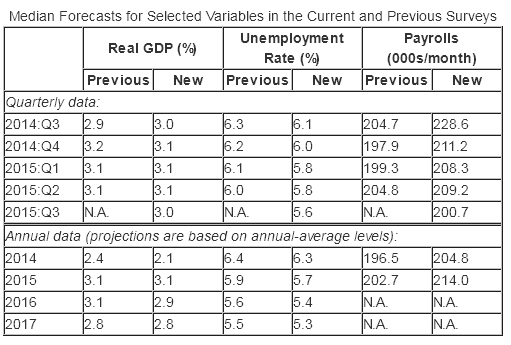
The outlook for growth in the U.S. economy over the next four years looks mostly unchanged from that of three months ago, according to 43 forecasters surveyed by the Federal Reserve Bank of Philadelphia. The panel expects real GDP to grow at an annual rate of 3.0 percent this quarter and 3.1 percent next quarter. On an annual-average over annual-average basis, the forecasters see real GDP growing 2.1 percent in 2014, down from the previous estimate of 2.4 percent. The forecasters predict real GDP will grow 3.1 percent in 2015, 2.9 percent in 2016, and 2.8 percent in 2017.

Healthier conditions in the labor market accompany the nearly stable outlook for output growth. The forecasters predict the unemployment rate will be an annual average of 6.3 percent in 2014, before falling to 5.7 percent in 2015, 5.4 percent in 2016, and 5.3 percent in 2017. These projections are below those of the last survey.
The forecasters are also more optimistic about the employment outlook. They have revised upward their estimates of the growth in jobs in the next four quarters. The forecasters see nonfarm payroll employment growing at a rate of 228,600 jobs per month this quarter and 211,200 jobs per month next quarter. The forecasters' projections for the annual-average level of nonfarm payroll employment suggest job gains at a monthly rate of 204,800 in 2014 and 214,000 in 2015, as the table below shows. (These annual-average estimates are computed as the year-to-year change in the annual-average level of nonfarm payroll employment, converted to a monthly rate.)
A NOTE TO USERS OF THE DATA FOR DENSITY PROJECTIONS FOR UNEMPLOYMENT AND GDP INFLATION
This survey is the third one to incorporate new ranges for the density projections for unemployment and GDP inflation. We first incorporated the new ranges into the 2014 first-quarter survey. Because the new ranges are the same in this survey as they were in the two previous surveys of 2014, users may compare results across the surveys that we conducted this year.
At the same time, users should exercise caution in comparing the results of the surveys in 2014 with those of prior years.
A NOTE TO USERS OF THE DATA FOR PERCENTAGE OF RESPONDENTS WHO USE THE NATURAL RATE
In our write-up for the third-quarter survey of 2013 (the last survey in which we polled panelists on their use of the natural rate of unemployment), we incorrectly reported the percentage of respondents who use the natural rate in their forecasts. We reported incorrect values for the third-quarter observations beginning with the one for 2009Q3. This survey shows the correct values.
The charts below provide some insight into the degree of uncertainty the forecasters have about their projections for the rate of growth in the annual-average level of real GDP. Each chart presents the forecasters' previous and current estimates of the probability that growth will fall into each of 11 ranges. The forecasters see lower probability of growth in the upper ranges in 2014. The probability estimates for growth in 2015, 2016, and 2017 are about the same now as they were in the previous survey.
- Mean Probabilities for Real GDP Growth in 2014 (chart)
- Mean Probabilities for Real GDP Growth in 2015 (chart)
- Mean Probabilities for Real GDP Growth in 2016 (chart)
- Mean Probabilities for Real GDP Growth in 2017 (chart)
The forecasters' density projections for unemployment, shown below, shed light on uncertainty about the labor market over the next four years. Each chart for unemployment presents the forecasters' current estimates of the probability that unemployment will fall into each of the 10 ranges. The charts show the forecasters are raising their density estimates over the next four years at the lower levels of unemployment outcomes, suggesting they are more confident about lower unemployment than they were in the last survey.
- Mean Probabilities for Unemployment Rate in 2014 (chart)
- Mean Probabilities for Unemployment Rate in 2015 (chart)
- Mean Probabilities for Unemployment Rate in 2016 (chart)
- Mean Probabilities for Unemployment Rate in 2017 (chart)
Forecasters See Higher Near-Term Inflation Even as They Leave Their Long-Term Projections (Nearly) Unchanged
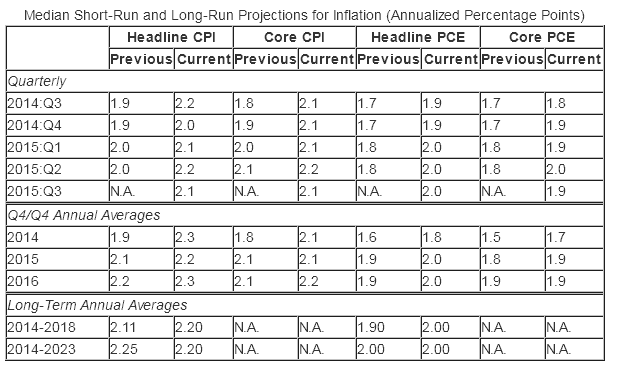
The forecasters expect current-quarter headline CPI inflation to average 2.2 percent, higher than the last survey's estimate of 1.9 percent. The forecasters predict current-quarter headline PCE inflation of 1.9 percent, higher than the prediction of 1.7 percent from the survey of three months ago.
The forecasters also see higher headline and core measures of CPI and PCE inflation during the next two years. Measured on a fourth-quarter over fourth-quarter basis, headline CPI inflation is expected to average 2.3 percent in 2014, up from 1.9 percent in the last survey, and 2.2 percent in 2015, up 0.1 percentage point from the previous estimate. Forecasters expect fourth-quarter over fourth-quarter headline PCE inflation to average 1.8 percent in 2014, up from 1.6 percent in the last survey, and 2.0 percent in 2015, up 0.1 percentage point from the previous estimate.
Core PCE inflation will average 1.7 percent this year (up from 1.5 percent in the last survey) and 1.9 percent in 2015 (up from 1.8 percent). The forecasters continue to see core PCE inflation averaging 1.9 percent in 2016.
Ten-year annual-average CPI and PCE inflation are projected to be 2.2 and 2.0 percent, respectively; nearly the same rates the forecasters predicted in the last survey.
The charts below show the median projections (the red line) and the associated interquartile ranges (the gray area around the red line) for the projections for 10-year annual-average CPI and PCE inflation. The top panel shows a slightly lower estimate for 10-year CPI inflation. The bottom panel highlights the unchanged 10-year forecast for PCE inflation, at 2.0 percent.
- Projections for the 10-Year Annual-Average Rate of CPI Inflation (chart)
- Projections for the 10-Year Annual-Average Rate of PCE Inflation (chart)
The figures below show the probabilities that the forecasters are assigning to the possibility that fourth-quarter over fourth-quarter core PCE inflation in 2014 and 2015 will fall into each of 10 ranges. For 2014, the forecasters assign a higher chance than previously that core PCE inflation will fall in the range of 1.5 to 2.4 percent.
- Mean Probabilities for Core PCE Inflation in 2014 (chart)
- Mean Probabilities for Core PCE Inflation in 2015 (chart)
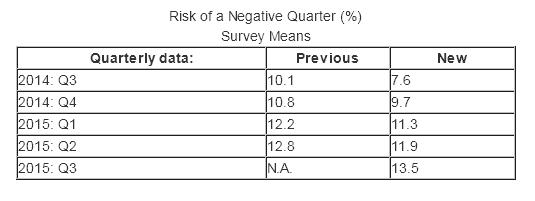
Lower Risk of a Negative Quarter
The forecasters see only a small chance of a contraction in real GDP in any of the next five quarters. For the current quarter, they predict a 7.6 percent chance of negative growth, down from 10.1 percent in the survey of three months ago.
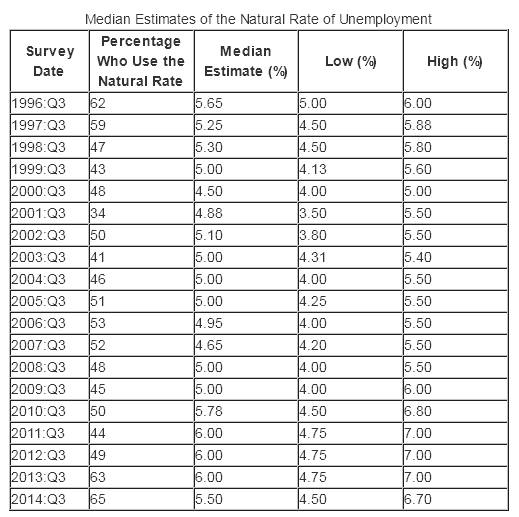
Natural Rate of Unemployment Estimated at 5.5 Percent
In third-quarter surveys, we ask the forecasters to provide their estimates of the natural rate of unemployment — the rate of unemployment that occurs when the economy reaches equilibrium. The forecasters peg this rate at 5.5 percent. The table below shows, for each third-quarter survey since 1996, the percentage of respondents who use the natural rate in their forecasts and, for those who use it, the median estimate and the lowest and highest estimates. Sixty-five percent of the 34 forecasters who answered the question report that they use the natural rate in their forecasts. The lowest estimate is 4.50 percent, and the highest estimate is 6.7 percent.


Comments
Log in or sign up to join the conversation.