

The third estimate of third quarter 2017 Real Gross Domestic Product (GDP) decreased marginally to 3.2 %. Sorry for the delay in publishing this post - but the internet sucks on Princess Cruises and they don't care. Specifically I would like to thank Brian OConnor, Vice President, Public Relations for Princess Cruises who refused my request for assistance.
Analyst Opinion of GDP
The consumer spending declined, but the real improvement came from using a lower inflation deflator. I am not a fan of quarter-over-quarter exaggerated method of measuring GDP - but my year-over-year preferred method showed moderate acceleration from last quarter.
The market expected:
| Seasonally Adjusted Quarter-over-Quarter Change at annual rate | Consensus Range | Consensus |
Advance Actual |
Second Actual |
Third Actual |
| Real GDP | 3.1 % to 3.4 % | 3.3 % | +3.0 % | +3.3 % | +3.2 |
| GDP price index | 2.1 % to 2.1 % | 2.1 % | +2.2 % | +2.1 % | +1.7 |
| Real Consumer Spending - Q/Q change | 2.2 % to 2.4 % | 2.3 % | +2.4 % | +2.3 % | +2.3 |

- Headline GDP is calculated by annualizing one quarter's data against the previous quarters data. A better method would be to look at growth compared to the same quarter one year ago. For 3Q2017, the year-over-year growth is now 2.3 % - up marginally from 2Q2017's 2.2 % year-over-year growth (but unchanged between the advance and second estimates). So one might say that the rate of GDP growth improved 0.1 % from the previous quarter.
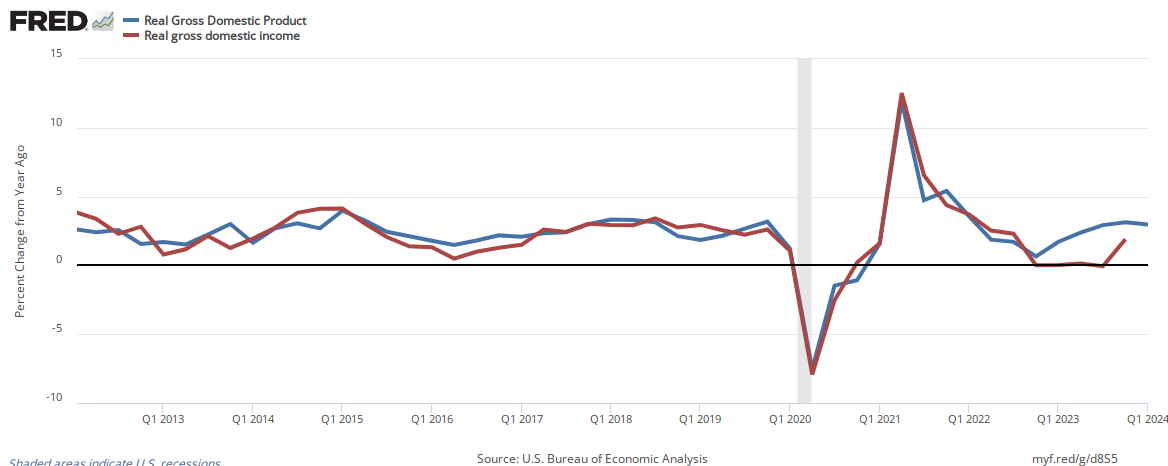
The same report also provides Gross Domestic Income which in theory should equal Gross Domestic Product. Some have argued the discrepancy is due to misclassification of capital gains as ordinary income - but whatever the reason, there are differences.
Real GDP (blue line) Vs. Real GDI (red line) Expressed As Year-over-Year Change
The GDP estimate released today is based on more complete source data than were available for the "second" estimate issued last month.
Real GDP per Capita

The table below compares the previous quarter estimate of GDP (Table 1.1.2) with the current estimate this quarter which shows:
- consumption for goods and services improved adding 1.4% to GDP.
- trade balance added 0.4% to GDP
- inventory change added 0.8% to GDP
- fixed investment growth added 0.4% to GDP
- federal spending insignificantly grew
The following is Table 1.1.2 before the annual revision: [click to enlarge]

What the BEA says about the third estimate of GDP:
The increase in real GDP in the third quarter reflected positive contributions from personal consumption expenditures (PCE), private inventory investment, nonresidential fixed investment, exports, federal government spending, and state and local government spending that were partly offset by a negative contribution from residential fixed investment. Imports, which are a subtraction in the calculation of GDP, decreased.
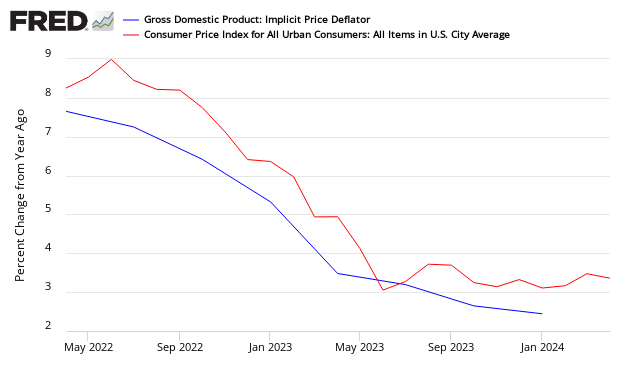
Inflation continues to moderate as the "deflator" which adjusts the current value GDP to a "real" comparable value continues to moderate. The following compares the GDP implicit price deflator year-over-year growth to the Consumer Price Index [this puts both on the same basis for comparision]:
What the BLS says about the revision from the second to the third estimate:
The downward revision to the percent change in real GDP primarily reflected a downward revision to PCE that was partly offset by an upward revision to state and local government spending

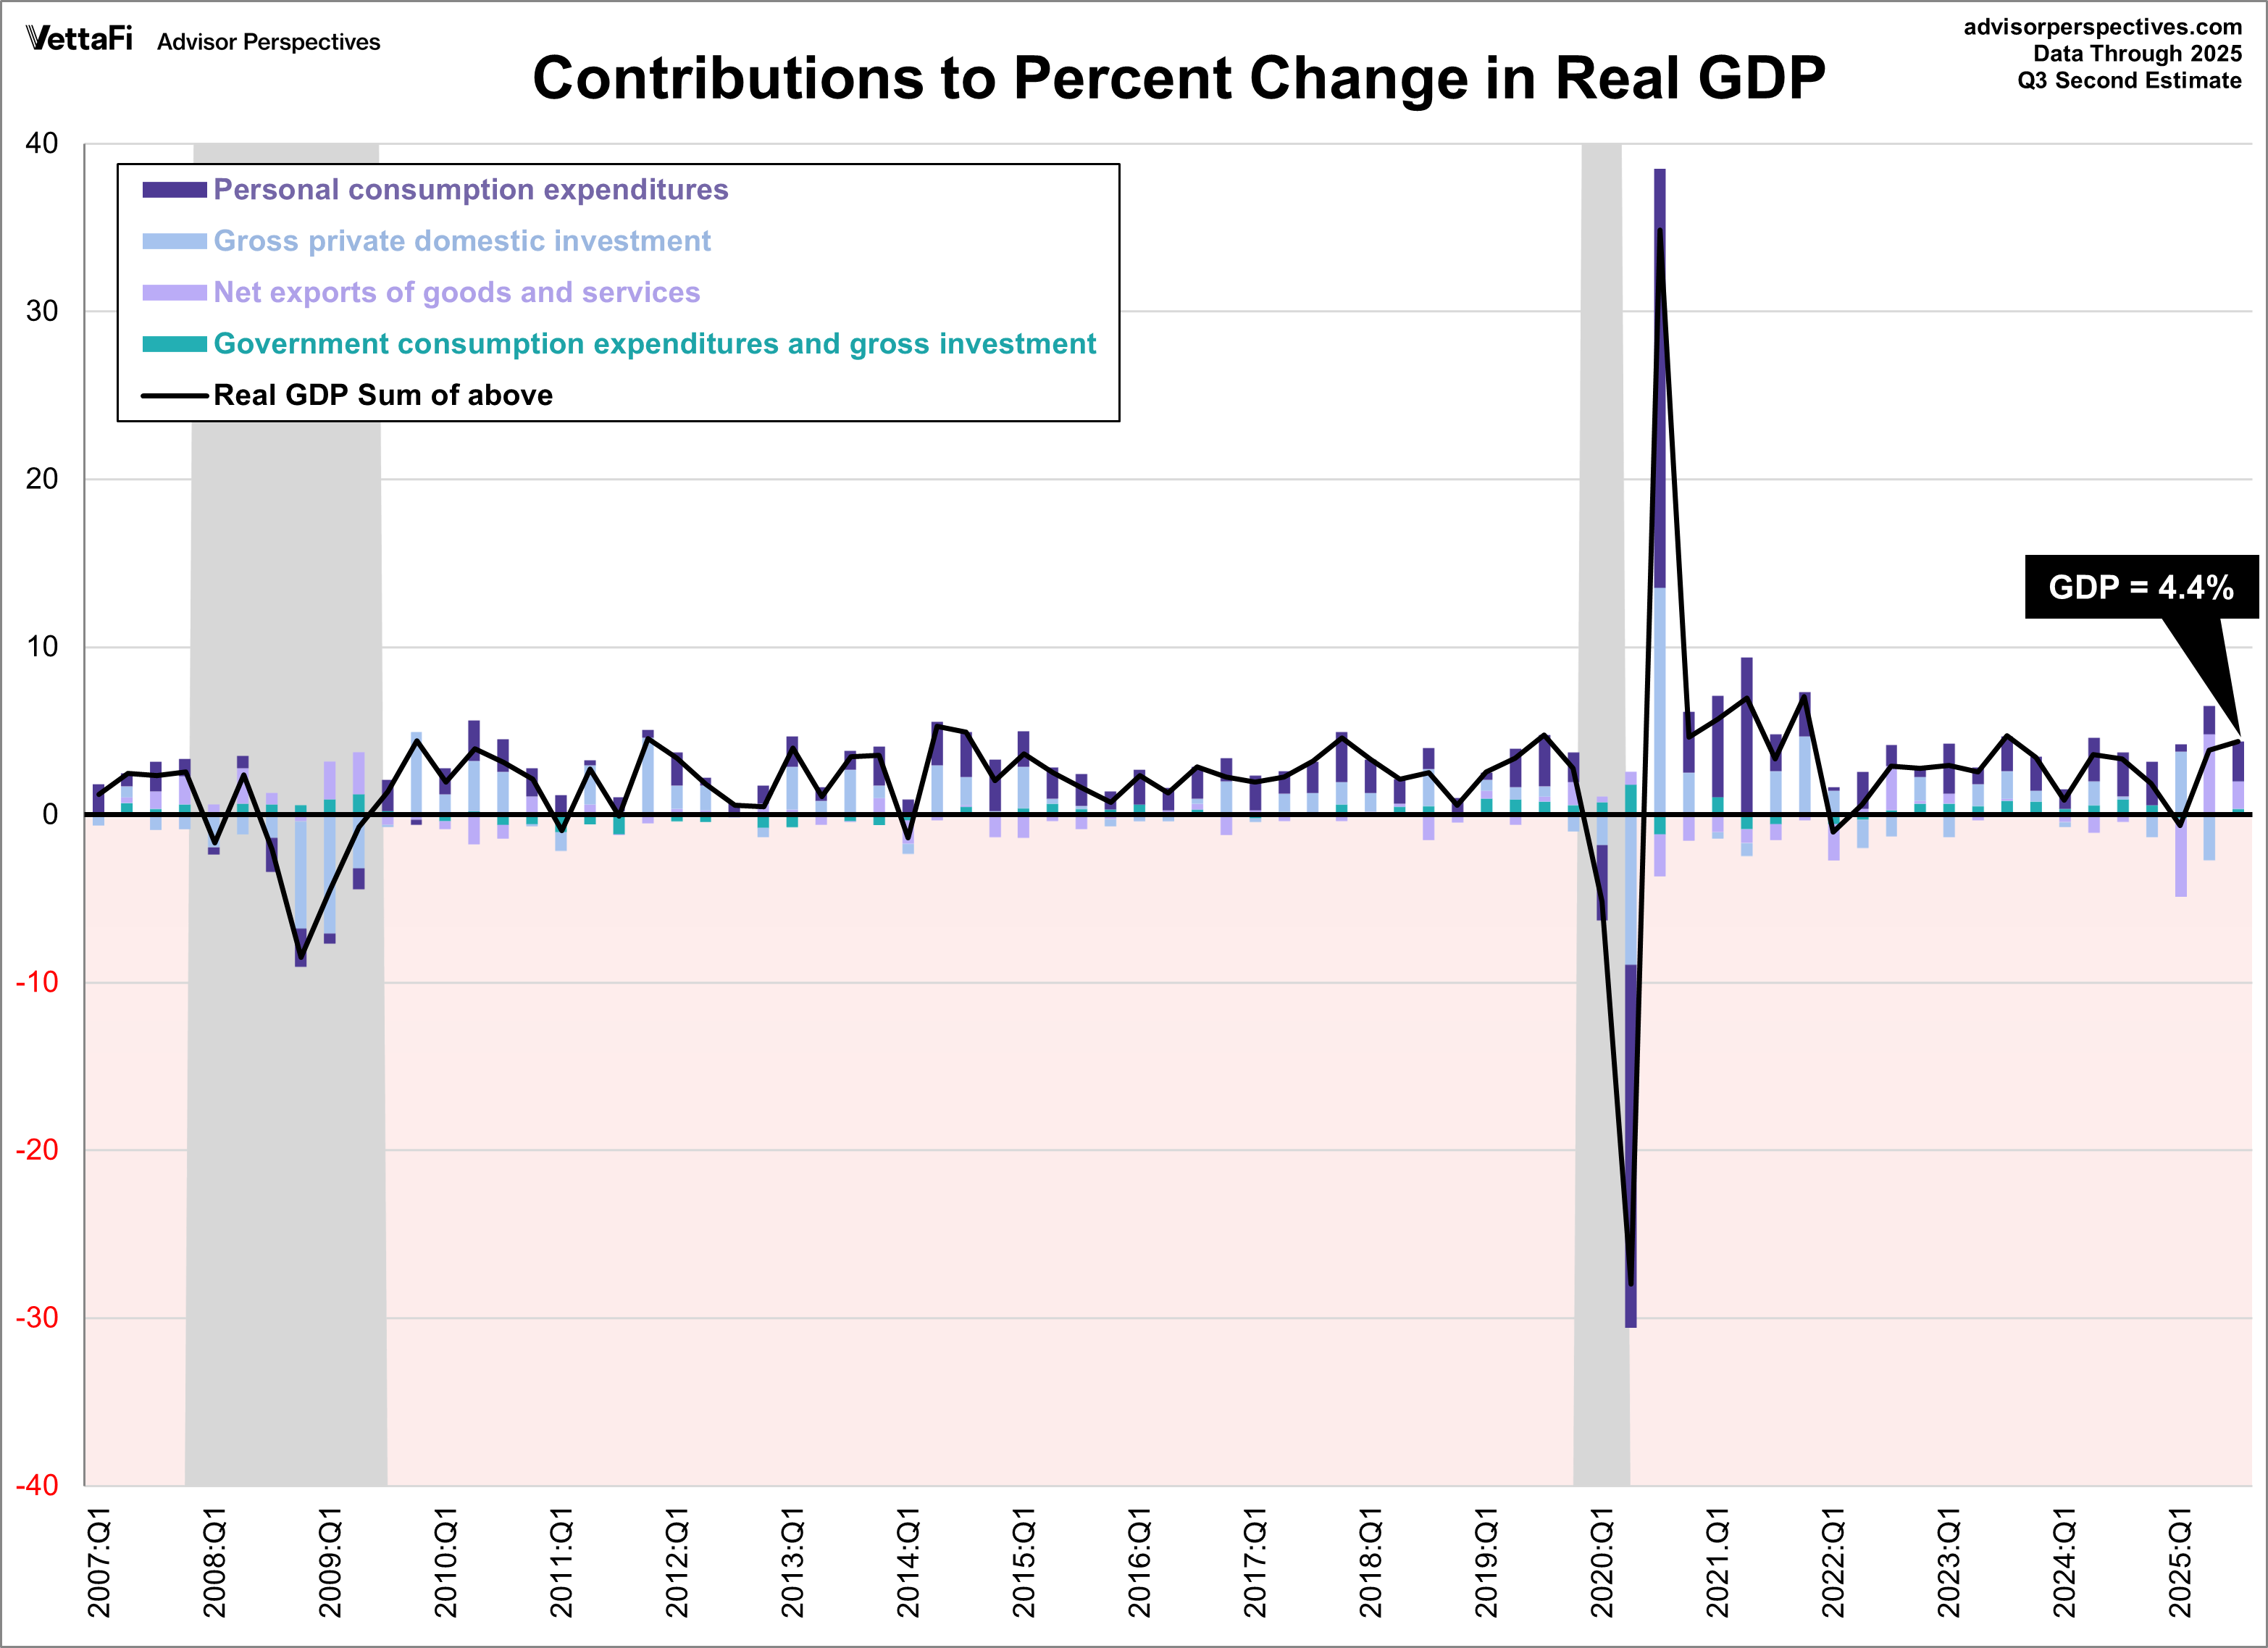
The chart below is a way to visualize real GDP change since 2007. The chart uses a stacked column chart to segment the four major components of GDP with a dashed line overlay to show the sum of the four, which is real GDP itself. As the analysis clear shows, personal consumption is key factor in GDP mathematics.
In the same release, corporate profits data was released showing less growth.
Profits from current production (corporate profits with inventory valuation adjustment and capital consumption adjustment) increased $90.2 billion in the third quarter, compared with an increase of $14.4 billion in the second quarter. Profits of domestic financial corporations increased $47.8 billion in the third quarter, in contrast to a decrease of $33.8 billion in the second. Profits of domestic nonfinancial corporations increased $10.4 billion, compared with an increase of $59.1 billion. Rest-of-the-world profits increased $32.0 billion, in contrast to a decrease of $10.8 billion. In the third quarter, receipts increased $26.9 billion, and payments decreased $5.2 billion.

Caveats on the Use of Gross Domestic Product (GDP)
GDP is market value of all final goods and services produced within the USA where money is used in the transaction - and it is expressed as an annualized number. GDP = private consumption + gross investment + government spending + (exports − imports), or GDP = C + I + G + (X - M). GDP counts monetary expenditures. It is designed to count value added so that goods are not counted over and over as they move through the manufacture - wholesale - retail chain.
The vernacular relating to the different GDP releases:
"Advance" estimates, based on source data that are incomplete or subject to further revision by the source agency, are released near the end of the first month after the end of the quarter; as more detailed and more comprehensive data become available, "second" and "third" estimates are released near the end of the second and third months, respectively. The "latest" estimates reflect the results of both annual and comprehensive revisions.
Consider that GDP includes the costs of suing your neighbor or McDonald's for hot coffee spilled in your crotch, plastic surgery or cancer treatment, buying a new aircraft carrier for the military, or even the replacement of your house if it burns down - yet little of these activities is real economic growth.
GDP does not include include home costs (other than the new home purchase price even though mortgaged up the kazoo), interest rates, bank charges, or the money spent buying anything used.
It does not measure wealth, disposable income, or employment.
In short, GDP does not measure the change of the economic environment for Joe Sixpack, and Joe Sixpack's kid, yet pundits continuously compare GDP across time periods.
Although there always will be some correlation between all economic pulse points, GDP does not measure the economic elements that directly impact the quality of life of its citizens.


Comments
Log in or sign up to join the conversation.