

As a reminder, we have made a change to the presentation of our market models and my oftentimes meandering morning market missives. The goal is to create a series of more concise, bite-sized reports, which will be published on a daily basis. Below is the weekly publishing schedule:
- Market Model Monday - A review of my key market models designed to indicate the state of the primary market cycle
- Technical Tuesday - An analysis of the current state of the market's trend and momentum
- Early Warning Wednesday - An examination the potential for countertrend moves
- Thesis Thursday - My take on the key market drivers (or whatever else may be running through my mind)
- Fundamental Friday - A look of the state of the market's fundamental factors
It is my sincere hope that you find the new schedule easier to consume and more beneficial to your investing endeavors.
Although the market's primary cycles do not change often, I still like to start each week with a clear understanding of what type of market we are dealing with. For me, a quick glance at the color of the cycle board and the weekly/monthly S&P graphs below tells me an awful lot about the "state" of the key market cycles.
My Current Take...
There is one change to report on the Primary Cycle board this week. After upticking to positive last week on the back of improvement in the economic composite, the Fundamental Factors Model slipped back to neutral this week on the heels of the earnings composite falling into negative territory. However, as I've been saying, I am currently taking the readings of the fundamental components with a grain of salt due to the fact that most of the models are long-term in nature and are not well suited for the current stop/start economic environment.
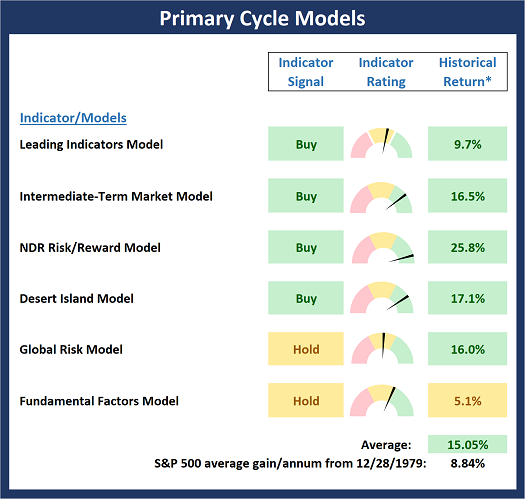
* Source: Ned Davis Research (NDR) as of the date of publication. Historical returns are hypothetical average annual performances calculated by NDR. Past performances do not guarantee future results or profitability - NOT INDIVIDUAL INVESTMENT ADVICE.
All in, I continue to view the big-picture market environment as moderately positive while recognizing that there are risks to be considered.
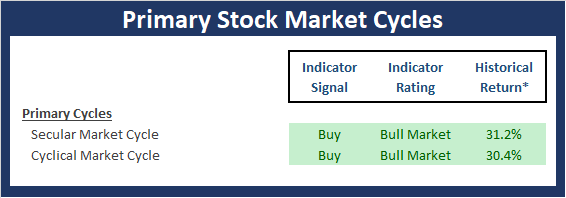
* Source: Ned Davis Research (NDR) as of the date of publication. Historical returns are hypothetical average annual performances calculated by NDR. Past performances do not guarantee future results or profitability - NOT INDIVIDUAL INVESTMENT ADVICE.
The Secular Market Cycle
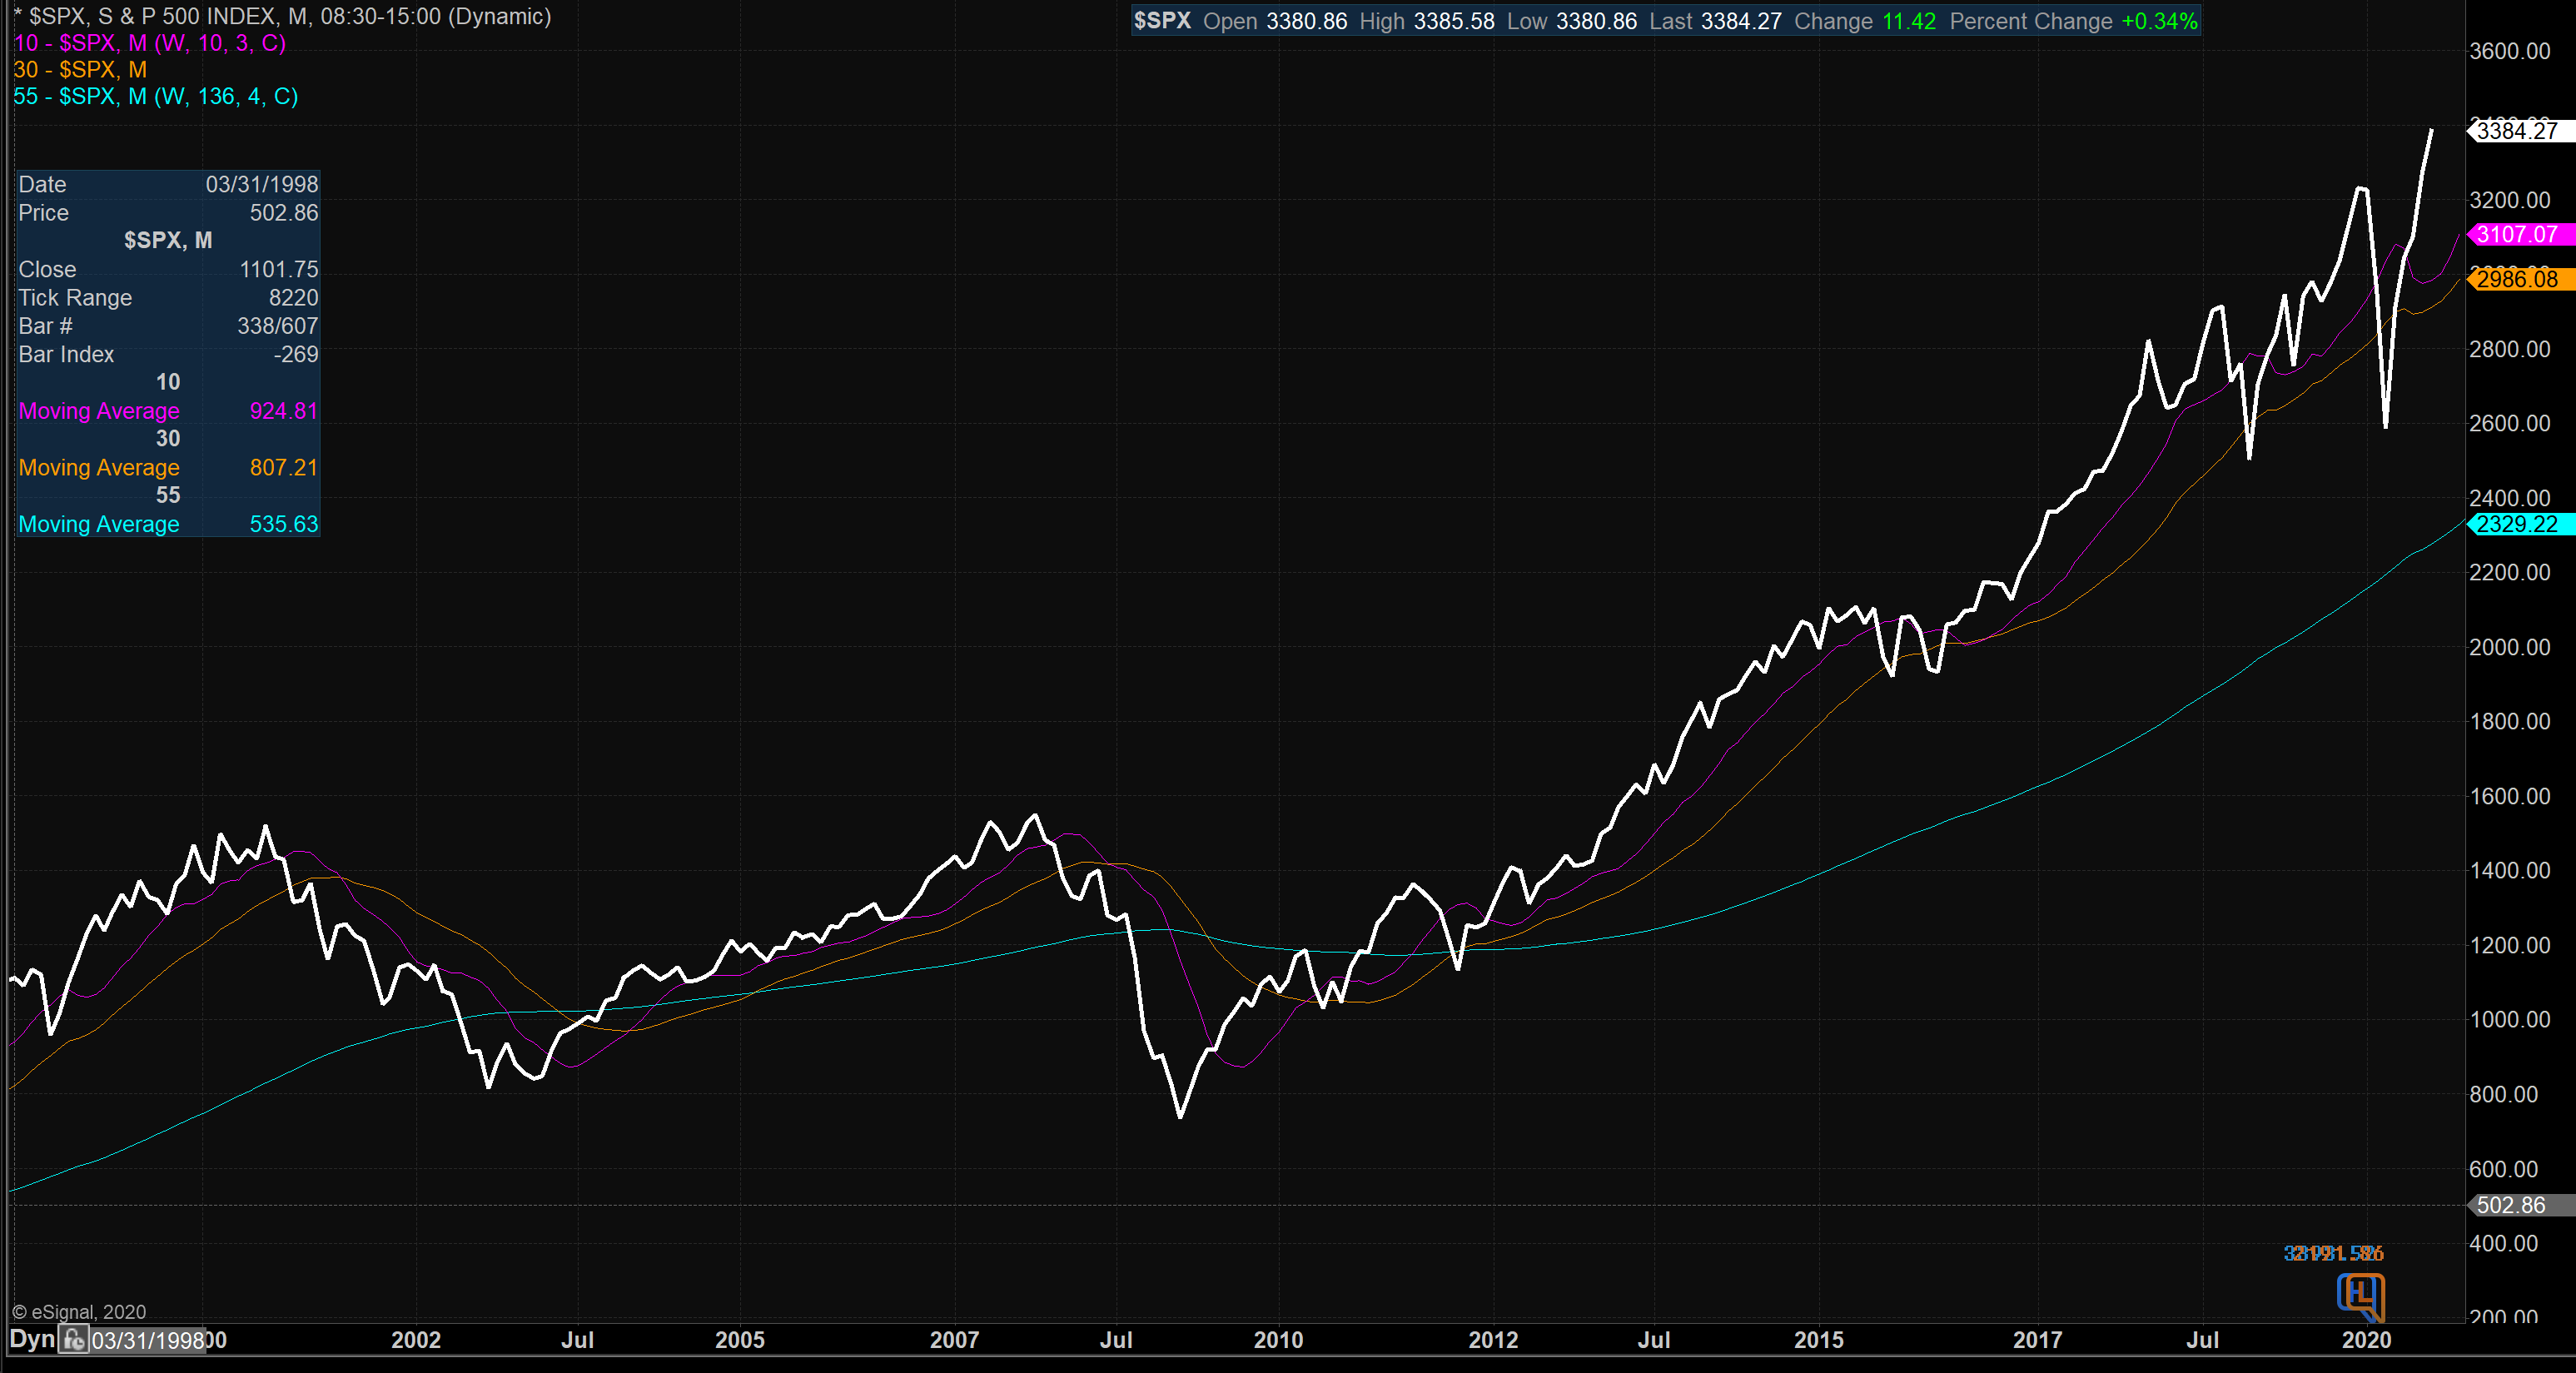
A secular bull market is defined as a period in which stock prices rise at an above-average rate for an extended period (think 5 years or longer) and suffer only relatively short intervening declines. A secular bear market is an extended period of flat or declining stock prices. Secular bull or bear markets typically consist of multiple cyclical bull and bear markets. Below is a monthly chart of the S&P 500 Index illustrating the current cycle, which we estimate began on March 9, 2009.
S&P 500 - Monthly
(Click on image to enlarge)
The Cyclical Market Cycle
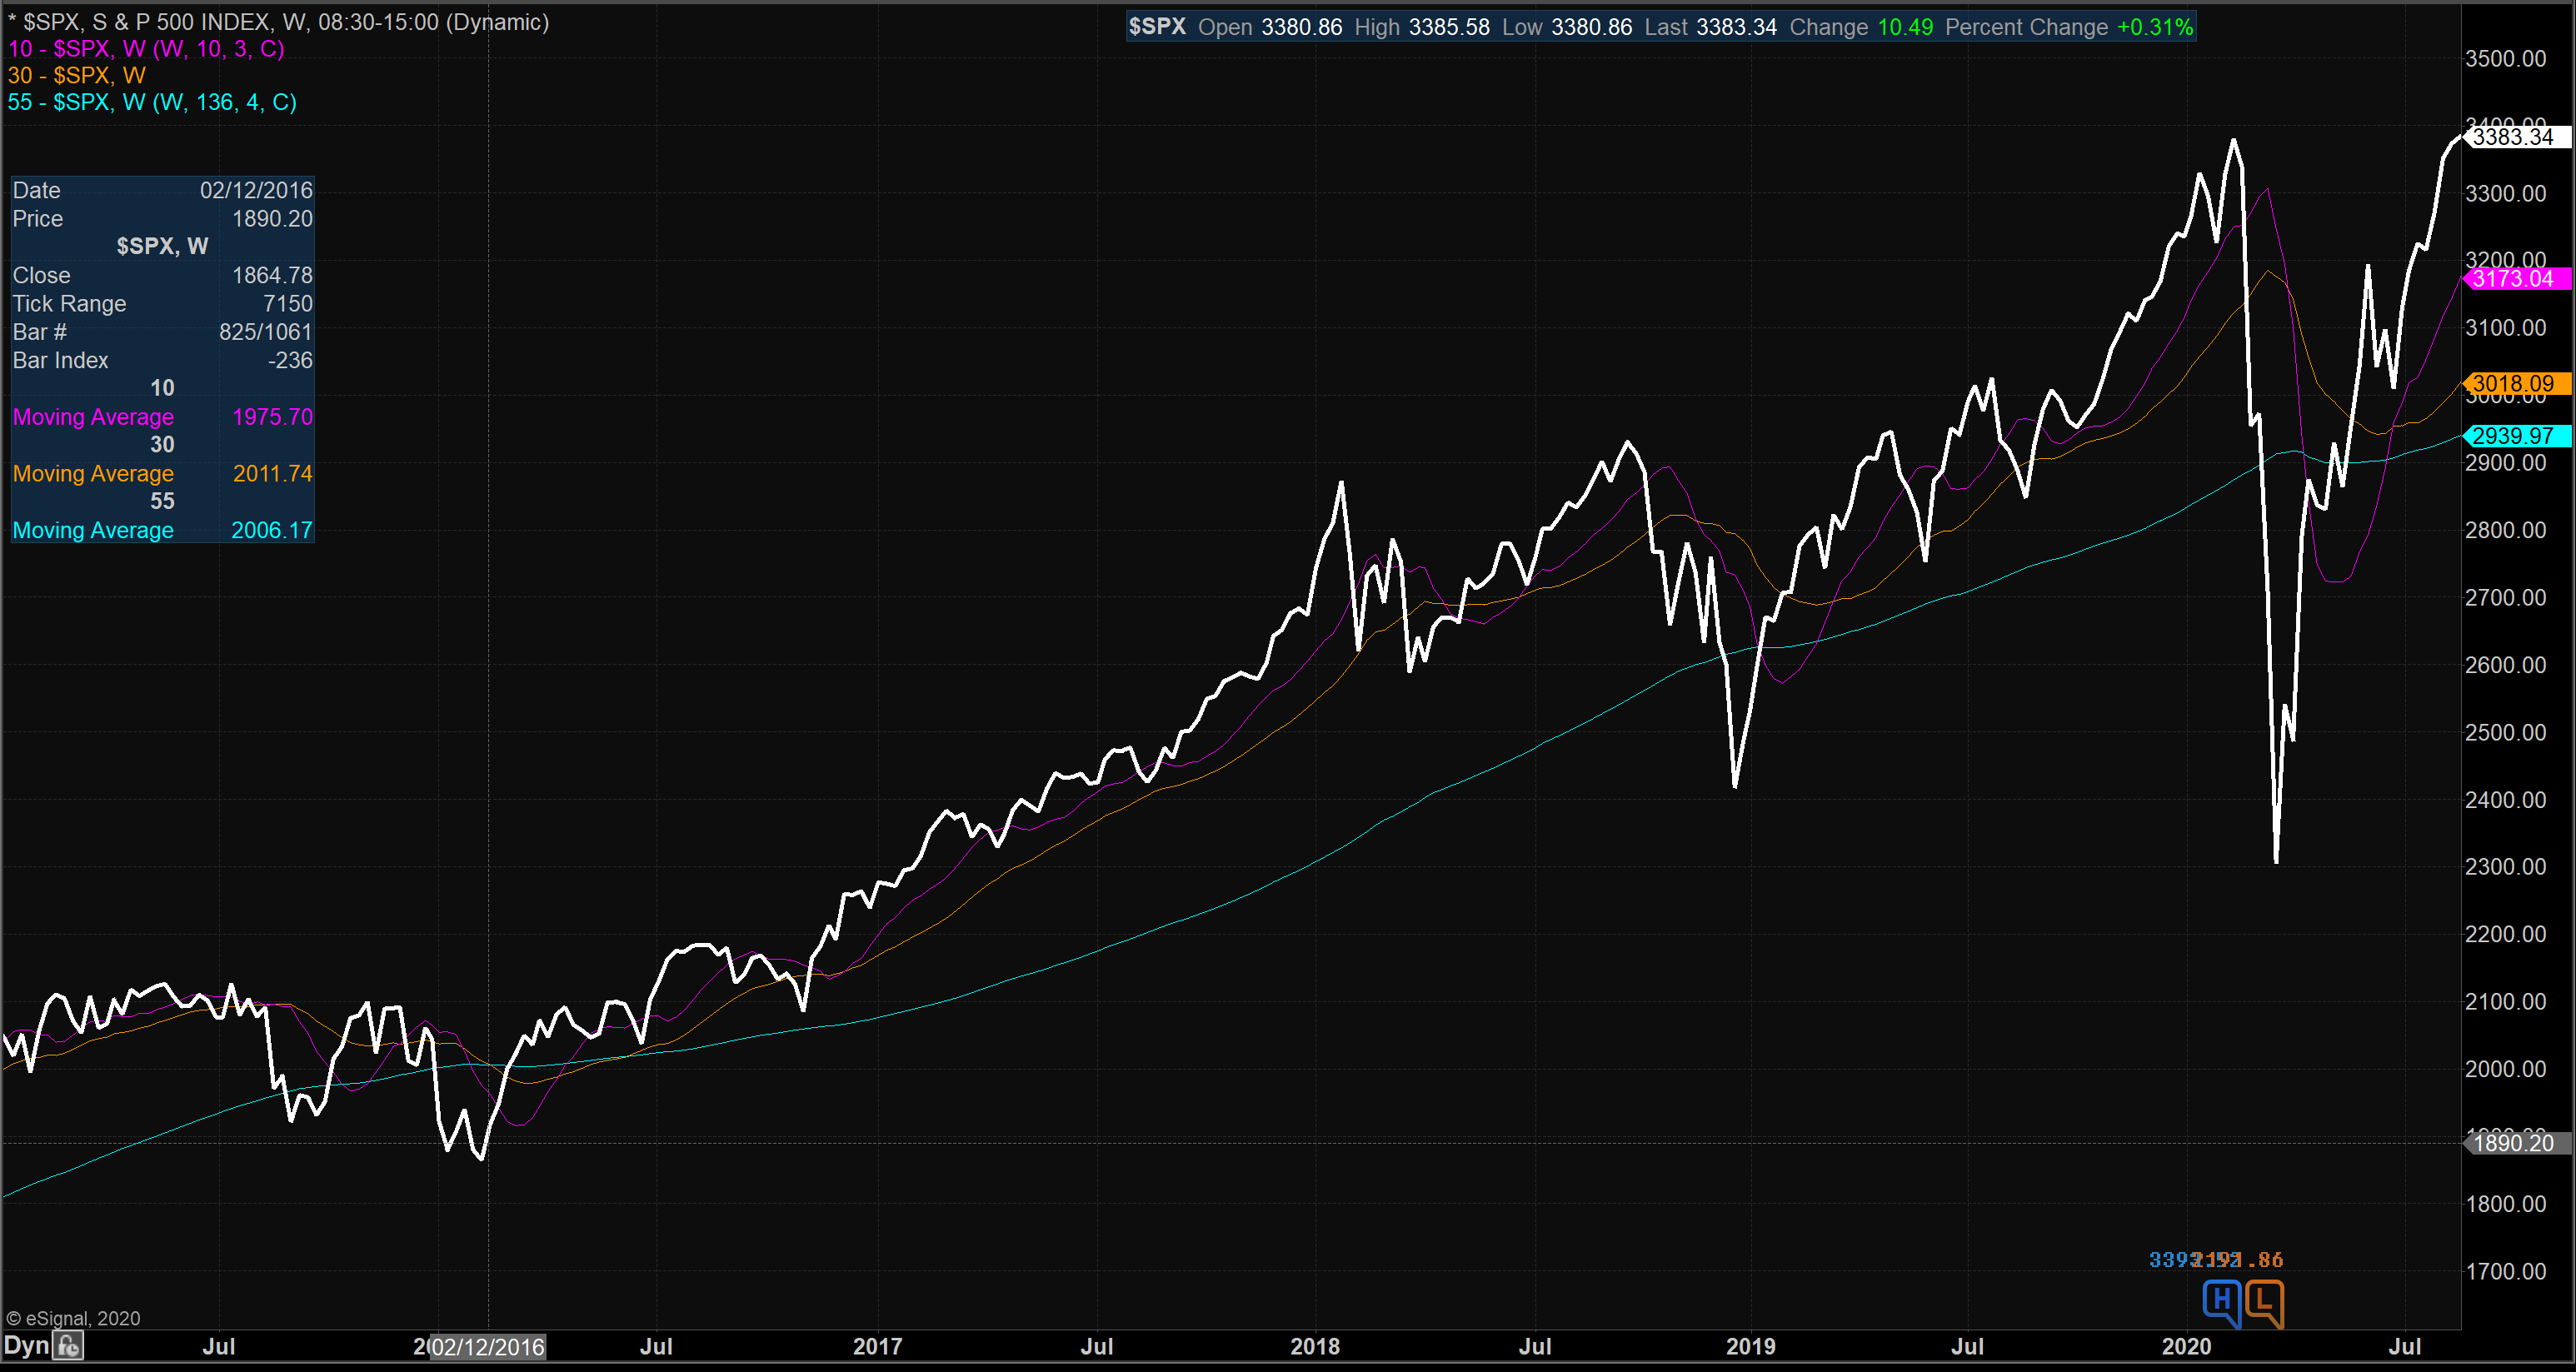
A cyclical bull market requires a 30% rise in the DJIA after 50 calendar days or a 13% rise after 155 calendar days. Reversals of 30% in the Value Line Geometric Index since 1965 also qualify. A cyclical bear market requires a 30% drop in the DJIA after 50 calendar days or a 13% decline after 145 calendar days. Reversals of 30% in the Value Line Geometric Index also qualify. Below is a weekly chart of the S&P 500 illustrating the current cycle, which we estimate began on March 24, 2020.
S&P 500 - Weekly
(Click on image to enlarge)



Comments
Log in or sign up to join the conversation.