
After many months of doubts and rumors, the Federal Reserve has finally announced the start of the long-awaited tapering this November, with a reduction in its monthly purchase programme of $15 billion dollars.
-min_(1).jpg)
In principle, this amount will also be maintained during December and the beginning of next year, although it could be revised in the future. Therefore, if the programme does not undergo any change, it is expected that next June the stimulus programme will come to an end completely.
However, the end of the programme does not necessarily imply the beginning of interest rate hikes - since, in principle, as Jerome Powell indicated - these will remain at current levels for the next year, as the Fed expects that the reduction of this purchase programme will gradually ease inflationary pressures.
This announcement has caused a rebound in the US dollar, with a rise of around 0.2%, which has led the dollar index to trade back above 94 dollars after losing ground during yesterday's session due to the uncertainty surrounding this meeting.
This strength in the dollar, has caused a decline of around 0.55% in the EURUSD, which is trading around 1.15440 dollars, close to the lows of October.
The EURUSD is following an important downtrend which has led it to lose the important support level represented by the lower red band. A confirmation of this break and the loss of the lows of October, would open the door to a further pullback towards levels near 1.14920 - which acts as its next support level - or even down towards lower levels in search of the meeting point of the lower band of the wedge formation and the support level around 1.14200.
As long as the EURUSD is unable to break above its downtrend line the sentiment will remain negative.
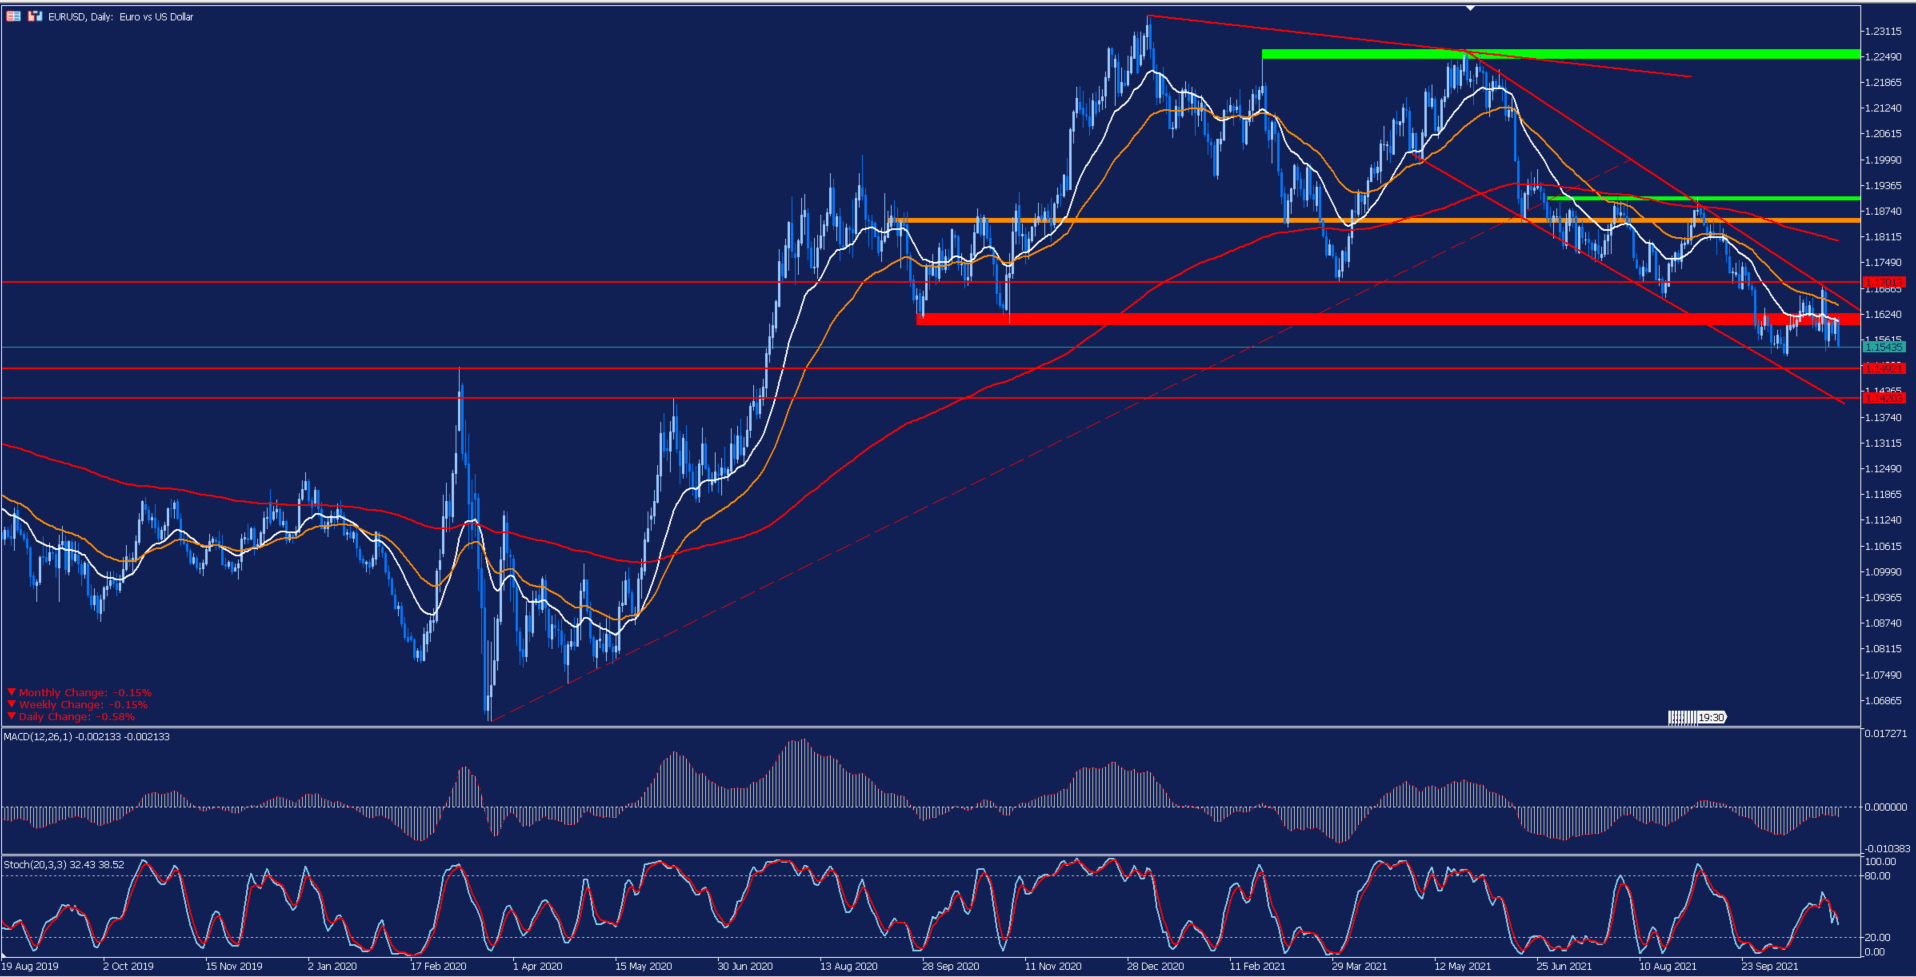
Depicted: Admirals MetaTrader 5 – EURUSD Daily Chart. Date Range: 16 August 2019 – 4 November 2021. Date Captured: 4 November 2021. Past performance is not a reliable indicator of future results.
Evolution of the last five years:
- 2020 = +8.93%
- 2019 = -2.21%
- 2018 = -4.47%
- 2017 = +14.09%
- 2016 = -3.21%
It is important to keep an eye on Christine Lagarde's appearance during today's session as it could provide clues about the European Central Bank's own monetary policy ahead of the next meeting.


Comments
Log in or sign up to join the conversation.