

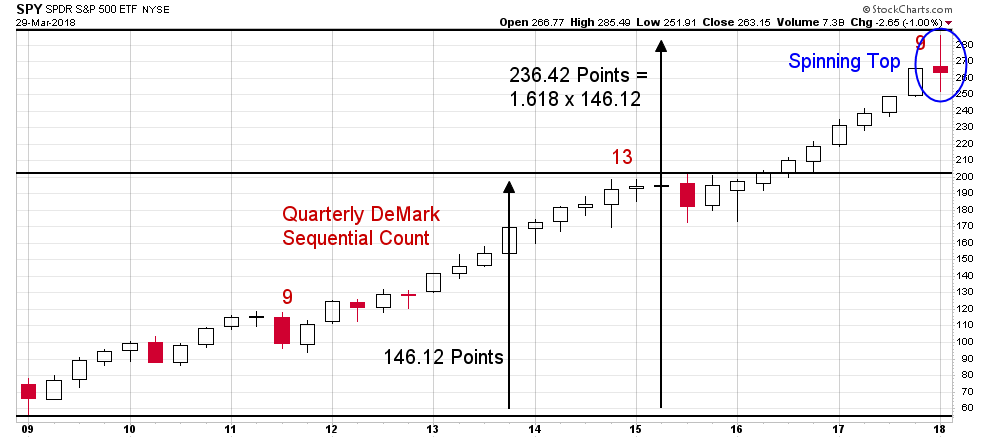
I have been calculating DeMark Sequential signals by hand for over a decade now. It’s one tool in my technical toolbox that I have found to be very helpful in identifying major trend changes. Last year I noticed we were approaching a long-term DeMark Sequential sell signal on the SPY ETF. That quarterly 9-13-9 sell signal triggered during the fourth quarter and to paraphrase Tom DeMark, ‘the 9-13-9 is one of the most powerful signals there is.’
Stocks obviously continued higher for a bit afterwards nearly touching the 1.618 Fibonacci Extension target noted in the chart below. They reversed, however, in February and by quarter end the ETF had completed a “spinning top” candlestick. To quote StockCharts.com, “After a long advance or long white candlestick [in this case both are applicable], a spinning top indicates weakness among the bulls and a potential change or interruption in trend.”
Taken all together, the technicals appear to have lined up suggesting there is a good probability we are already in the midst of a major reversal at this point. In fact, it’s nearly the exact opposite of the bullish technical setup we saw back in 2009.
(Click on image to enlarge)



Comments
Log in or sign up to join the conversation.