
- The S&P 500 Index lost circa 250 points in 6 trading days. There's a system which called the top, and may also call the bottom -- ending the bloodbath.
- The market's monetary systemic liquidity situation has been leading, and tracking, the asset markets very well. The models called the interim top in mid-July, and also called the current sell-off.
- We're confident that familiarity with the seasonal ebb and flow of largess from the US Treasury and the Federal Reserve will enable investors to anticipate the trajectory of risk assets.
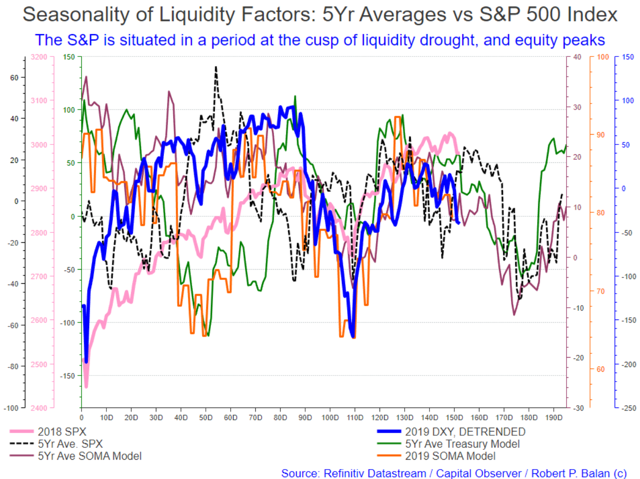
- The optimal trough for the current equity sell-off is August 5 -- and that hold true for the 2019 SOMA (Fed) model and the 5-year average of the models, allowing for a plus/minus 2 days spread needed when optimizing weekly data points. Nonetheless, even the Treasury Models, as applied to the yields, is also indicating a likely temporary pause in the yield decline very soon.
- It is clear, especially from the Treasury Model, that the sell-off is not over yet. The equity markets and yields are probably due a brief interlude of stability very soon, so any bounce that we get this week may be sold again to complete the downwards trend, in late August-early September.
A series of jackhammer blows felled the markets
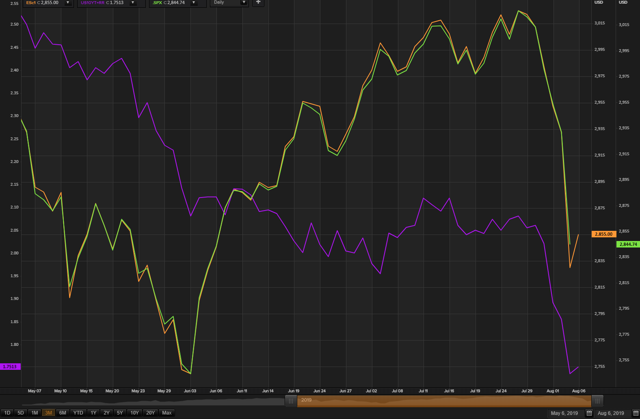
There were large moves in equities and yields over the recent weekend and subsequent Sunday overnight, a follow-through to the sell-off which started with the Fed's underwhelming 25 basis points rate cut, then reinforced by President Donald Trump's imposition of new tariff's on a batch of China's export to the US.
The markets were further hammered the following Monday in Asia and Europe when China allowed the CNY to fall below its 7.00 valuation versus the US Dollar, and that is also on top of the escalation of the turmoil in Hongkong. The sharp devaluation of the CNY inflicted a lot of damage to market sentiment. Yields and all risk assets fell; gold and the rest of the Precious Metal sector soared. The S&P e-mini futures were down by as much as 250 points after the New York market closed on Monday.
(Click on image to enlarge)
China's CNY devaluation is self-preservation
The critical point about the breach of 7.00 in the USD/CNY FX rate is the fear of market traders that a currency war was about to explode. But that's an over-reaction to something that has been simmering under the surface for a while. A currency war has been brewing since QE was implemented globally and competitively by central banks in November 2008. What is new is China's overt participation in a currency war -- but that too should not be a surprise. China has been managing the CNY lower since the country joined the World Trade Organization (WTO); the CNY's supposed undervaluation has been a constant irritant with its trading partners. But in this new case, China has no choice -- it had to devalue quickly.
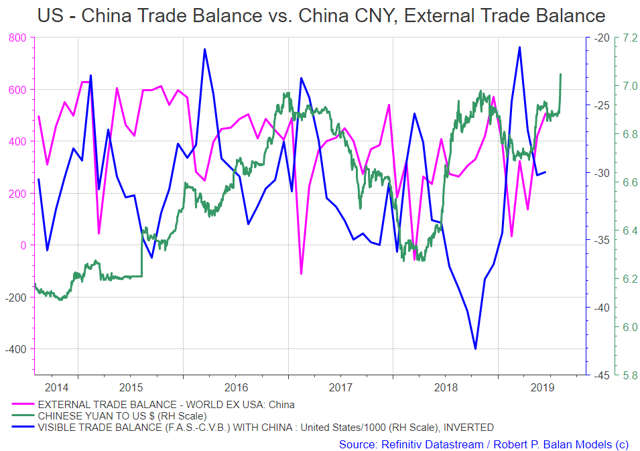
If China cannot sell to the US, then it will sell to the Rest of the World. So it must have a very competitive currency to do that. China-US trade balance has fallen significantly since Q1 this year, although it has already stabilized. But China's trade deficit with the rest of the world is actually increasing (see chart above). What the US is not buying, the rest of the world is purchasing. For China to sell well to the RoW, the CNY has to very competitive. China has been able to sell to the RoW because of the progressively weaker domestic currency. There is actually nothing wrong with total world trade from this perspective -- the slack between US and China trade is apparently being made up for by China's increased trade volumes with the RoW. So the impact of a currency war, if it comes to that, would not be a big jolt to the global economy.
China, and US steps back from the brink
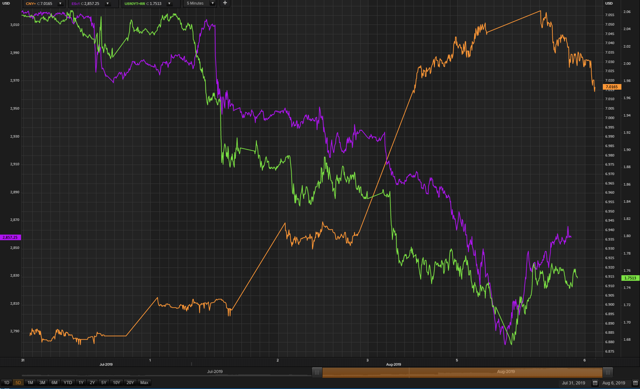
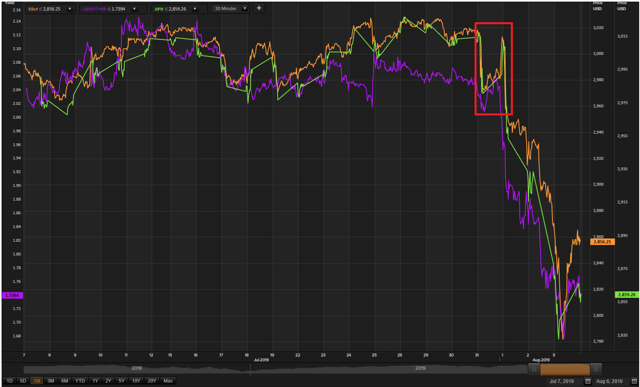
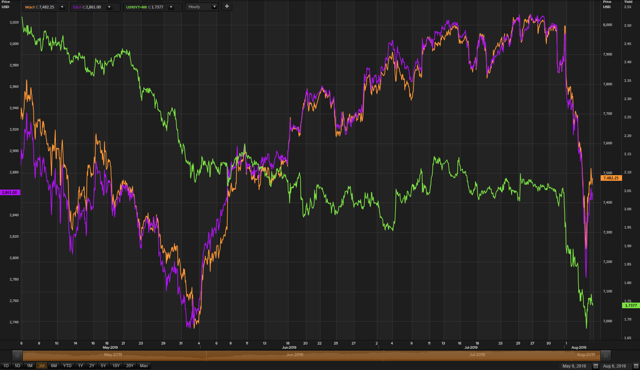
For a few hours on Monday, it looked like the FX traders' worst nightmares were coming true. But China actually walked back from the brink later in the day, by guiding Tuesday's CNY fixing above 7.00. The USD/CNY rate has been steadily falling since then, and with it, risk assets and yields correspondingly rose (see chart below).
(Click on image to enlarge)
We speculate that China intended the 7.00 breach as a warning shot, but the US Treasury responded very quickly with an even more emphatic warning shot of their own by branding China as a currency manipulator. That carries big, possible repercussions to China within the World Trade Organization if the US pursues a redress process. With China's move to guide the CNY back above 7.00, and by desistance of the US Treasury from pursuing the matter further, the world was given respite from the jackhammer blows that were dealt the markets since the Fed underwhelmed market expectations on July 31.
If the fears of a currency war and the deleterious impact it has on world trade are baseless, then the genesis of the current market sell-off does not have structural roots. If, so forecasting the events which follow the sell-off becomes more tractable. Off-hand, a significant part of the market damage seems to have been caused by market sentiment's rapid rise to panic. All of this is happening during a periodic systemic liquidity drought, which is further exacerbated by bond market travails due to the US debt ceiling cap.
With Armageddon stayed, liquidity models can do their job properly
Put another way, if there are no state sponsors which are proactively involved in tangential destruction of the markets, then normal analytical tools should be able to project what could happen next. The tools we speak about include the seasonality profile of systemic liquidity flows from the Federal Reserve and the US Treasury.
There is a general misconception about the impact of liquidity flows on financial assets. There are several memes, the major one claiming that there is a direct linkage between the amount of systemic liquidity and the level of risk asset prices. Our work does not support this claim. The seasonality of systemic liquidity flows does NOT cause market rallies or declines, per se. But the state of the liquidity flows amplify the impact of news flow, positive or negative, on the price of assets. Nothing more, nothing less. Liquidity flows may be likened to the reverse effect of gravity -- strong inflows accentuate positive news flows, and strong outflows put the focus on negative new flows.
Systemic liquidity data are well publicized and are readily available. However, their implications are unfortunately still not familiar to many investors. As remedial measure, the head of Seeking Alpha's MarketPlace, Mr. Daniel Shvartsman did a one-on-one interview with me about Systemic Liquidity on May 25, 2019 (here). Mr. Shvartsman described systemic liquidity as "(e)xisting somewhat perpendicular to these two axes (of fundamental and technical analysis) is the analysis of quantitative behavior in the market. In this case, I'm speaking about central bank behavior."
Systemic liquidity flows are important to banks
In many respects, the ebb and flow of money from the US Treasury and the Fed, into and out of the US financial system, have even more immediate consequences on risk assets than the manipulation of the policy rate rates (Fed Funds Rate), which is a blunt and slow-acting instrument.
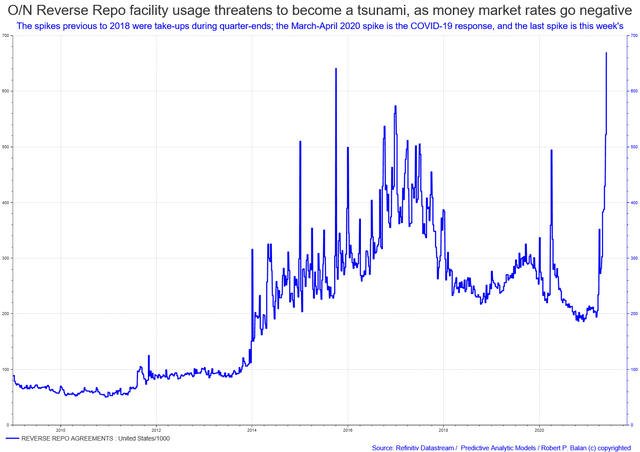
For one, the Fed's Balance Sheet, and the Bank Reserves (Required+Excess) determine the underlying costs of Temporary OMO Repos and Reverse Repo Agreements, and the structure of various term (money) market rates (see chart below).
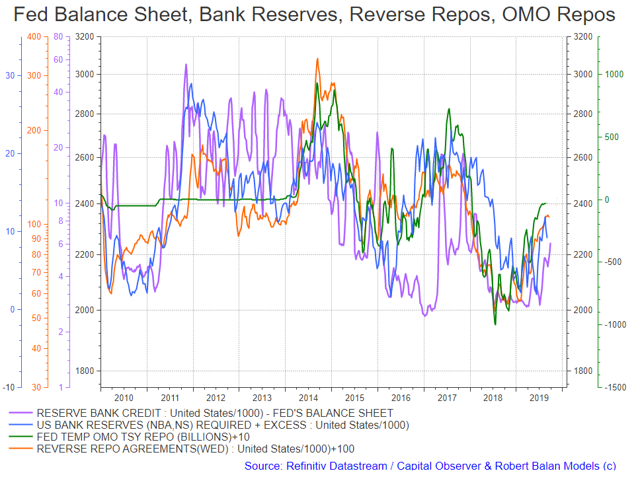
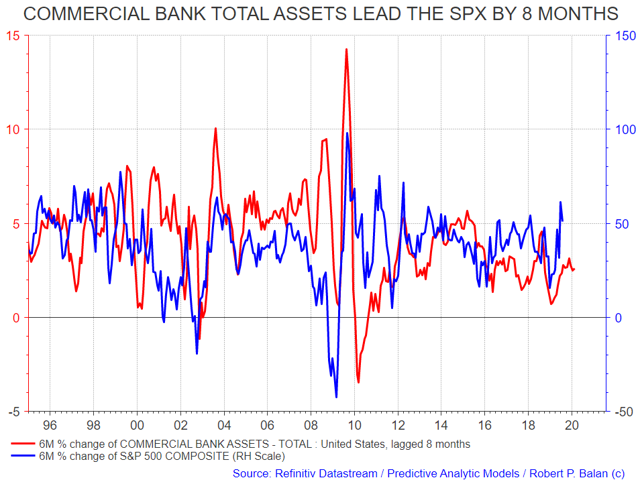
These flows fund the US shadow banking sectors' collateralized borrowing and lending—in particular, repurchase agreements (repos) and reverse repurchase agreements (reverse repos) -- transactions in which the borrower of funds provides securities as collateral. These short-term borrowing transactions help commercial and investment banks adjust the leverage of their balance sheets (Adrian, Shin 2008, here). Adrian and Shin defined "leverage" as the ratio of total assets to equity (net worth). Changes in the banks' leverage has a large impact on risk assets like equities. In fact, changes in aggregate commercial bank total assets is a reliable gauge of how the S&P 500 Index performs in about 8 months (see chart below).
Laying the analytical groundwork on July 18
In the final analysis, the utility of systemic liquidity flows depends on how the information they provide can help the investor navigate around what we call "liquidity sink holes" distributed in the financial calendar. The well-defined seasonality of liquidity ebb and flow can provide a roadmap to avoid, or in most cases, actually benefit from those flows. For instance, the stock market market sell-off in August, right after the Fed underwhelmed market expectations, has been flagged in advance by the very well known seasonal liquidity drought from early August to early September.
We documented this possibility on the daily Market Report which was published at the PAM chat on July 18 (here). Coming out on an initial equity decline which took place during the second half of July, we said:
We are having the upside response to the recent decline in equities. It could be the right shoulder of a H&S technical pattern, or a new high altogether; we will follow the inflection point of the liquidity models in determining how high this new rally will go, as well as the subsequent sell-off.
PAM expects this forthcoming sell-off to bottom during the first week of August; followed by two weeks of upside correction, then finally, further sell-off until the first week of September.
We see those timing elements from the liquidity models published with the report on July 18. The charts provided in this article feature the SOMA model, which is works on the flows generated by the OMO activity of the New York Fed (as the bank manages the US Monetary Base). The charts also feature the Treasury Model, which tracks the flows of US Treasury Cash Balance (TCB) account at the Federal Reserve.
Original chart published on July 18.
Given the equity outlook, the bond yield forecast was straightforward:
We expect fairly large declines in yields . . . The main thrust lower for bond yields bottoms on July 22, followed by a week of bounce, then another large decline until late August or early September.
Original chart published on July 18.
PAM added narratives, made minor course corrections, and discussed assets and instruments to trade in a couple of subsequent reports (here, and here). Then, finally, Fed Chair Jay Powell on July 31 disappointed the markets which precipitated a market sell-off. The Powell sell-off was immediately followed by consolidation rally on August 1, after a dismal ISM print followed by an even worse construction spending data sparked a renewed hope that conditions are dire enough to force the Fed to cut more than Powell has admitted.
(Click on image to enlarge)
The system liquidity conditions on August 1 exacerbated a melt-down
Despite the very high market volatility, the models reaffirmed their previous readings (the full August 1 PAM report can be seen here): the drought in systemic liquidity is exacerbating the negative news flow, and is amplifying the market sell-off.
Original chart published on August 1
The ongoing sell-off promises to be large, but it soon approaches a short-term stock market support, which looks to occur after a week. And that is supported by high-frequency analysis.
The current uptick resolves into further declines until August 5, if the models' inflection points are correct. Then upside barriers appear sometime in August 22, plus/minus 2 days. It should be followed by further declines until late August - early September.
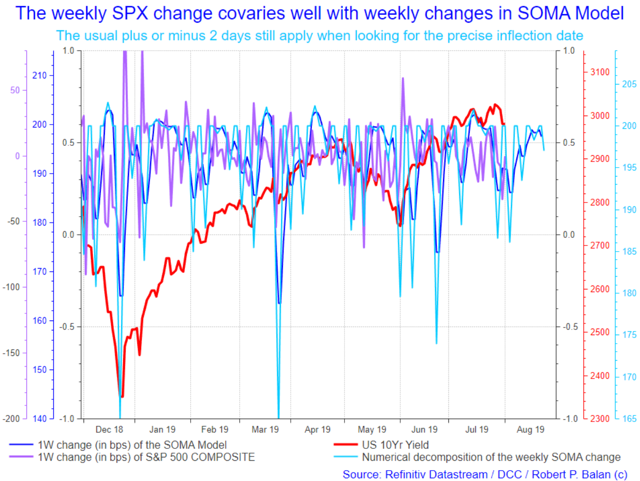
The high-frequency analysis mentioned above includes a numerical decomposition of both the SPX, and the SOMA Model. This model has a fairly robust forecast history. This model projected a likely SPX trough on August 5, followed by a recovery which could last for two weeks (see chart below). The sell-off resumes thereafter.
Original chart published on August 1
The bond yield outlook also tracks the equity forecast well, as both yields and SPX were undercut by poor market sentiment. Bad news has finally become a bad factor for equities; both equities and yields have started falling in synch after negative news flow, for the first time in many weeks.
Original chart published on August 1
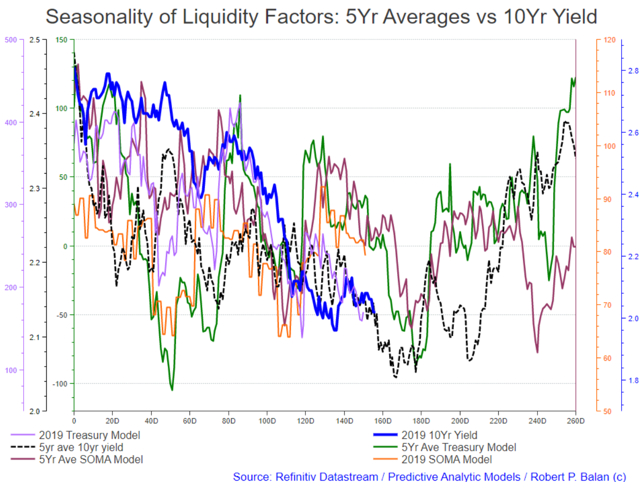
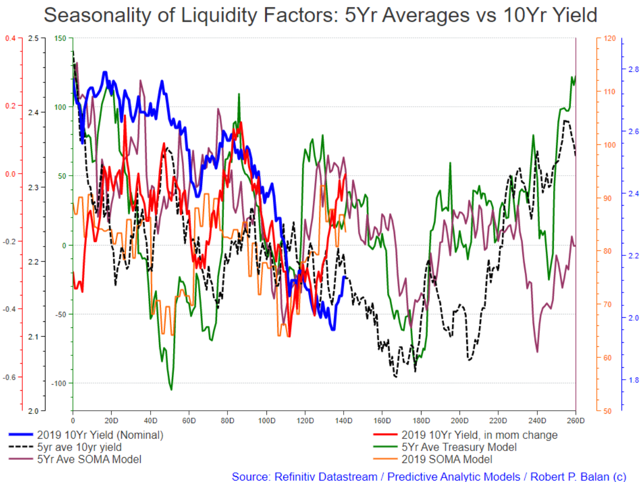
This is how the current 2019 10yr yield is moving in relation to the historical averages of the Treasury and SOMA liquidity models.
By and large, the bottom of the 10yr yield may seen in a week, if the current yields perform more or less in accordance with what we have seen in the past five years. The decline could take longer if we eventually get a deep dip in yields sometime during Trading Day 180. We expect a trough in yields by early September.
Fast forward to August 6 (today): blood-letting not over yet
(Click on image to enlarge)
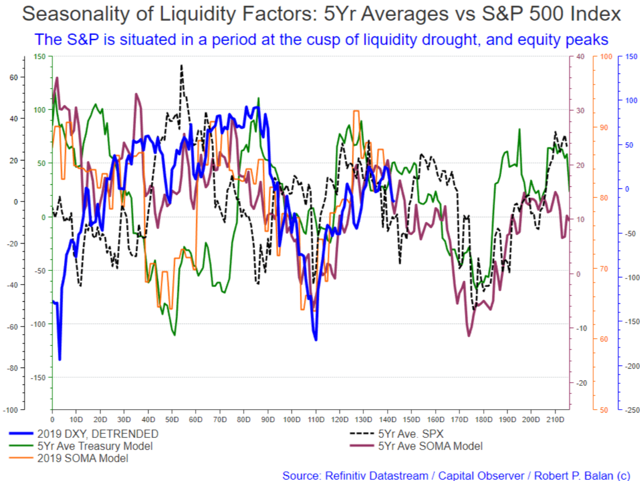
The 5-year averages have been proven correct about market troughs on August 5, and subsequent consolidation higher for several days (see chart above).
The high-frequency model also looks emphatically correct about an August 5 low. This model also posits that the current recovery should indeed take place over several days.
Despite the sudden shifts in the tone of the news flows, and extreme market volatility, the models are still tracking the market changes well. The aligned data shows that the financial markets are still faced with possible negative implications of declining liquidity until trading day 180, or late August-early September (see chart below). The SPX should bottom sometime in late August-early September.
We expect to see again the lows seen in the SPX emini futures (ESc1) in early June -- that would be at circa 2730. The market could even have some slippage below that, but that is the appropriate downside target in the current down cycle.
For bond yields, the implications of liquidity drought will continue to reverberate for some time. There are still few weeks left before the TCB reaches a trough, and then the Treasury will rebuild its cash balances, and yields should start to rise.
The crucial date in Treading Day 180. We are now at TD 156, but we add 10 trading days for the usual market front-run, therefore the crucial period to expect a trough is just 15 trading days away (180 less 166), from August 6 when this article was written.
The 10yr yield looks headed for 1.6%, or even slightly lower.
It also happens that the current yield (2019 10yr yield) is tracking the 2015 yield performance very well. We have been keeping an eye on it for a while, and we believe it is a good template for what to expect for the 10yr yield this year.
Conclusion: happier times in Q4
By Q4, yields and equity markets should be upwards bound, as the Treasury and the Fed, at that time, build-up cash balances for the forthcoming Christmas season, and year-end demands for cash by enterprises and the private sector. Moreover, Mr. Trump and Congress just agreed on another round of two-year spending that will be larger than recent years. Talk about ultimate systemic liquidity, on steroids. That should be excellent for risk assets, but bad for bonds (see chart below).
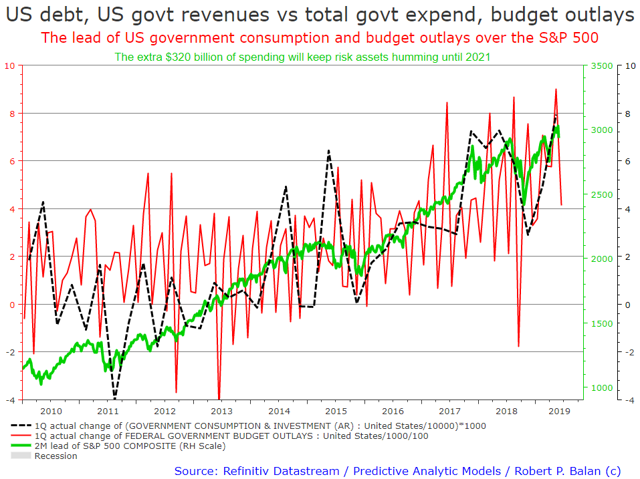
The last quarterly change in the federal gov's outlays was actually negative, and it is probably contributing to the misery that the market is feeling right now. But we are very certain that the next quarterly change up will be positive, and that should help drive the markets higher from whatever lows we may see over the next few weeks.
We should have a Santa Claus stock market rally this year.

Comments
Log in or sign up to join the conversation.