

The robo machines pushed their snouts through 2100 on the S&P index again today. This was the 13th time since, well, February 13th that this line has been re-penetrated from below.
Click on picture to enlarge

But don’t call it an omen of bad luck; its more like monetary rigor mortis. The bull market is dead, but the robo-machines and talking heads of bubble vision just don’t know it yet.
And most certainly, the full-time stock traders who occupy the C-suites of corporate America don’t know it, either. They are still buying their own drastically over-priced shares hand-over-fist. During last Monday’s knee-jerk rip even Goldman Sachs confessed that their corporate buyback desk had a record day.
That should not be surprising, however. America’s stock option addicted executives are getting desperate. With nearly all of the S&P 500 companies having now reported Q2 results, LTM reported earnings have come in at about $97.35 per share. That’s down 5.6% from prior year and 8.2% since the cycle peak in Q3 2014.
What’s worse, GAAP earnings are rolling over a point that represents niggardly gains from the Q2 2007 peak prior to the last bubble’s collapse. While the magic 2100 line represents a 35% gain from the October 2007 high, earnings growth during the last eight years computes out to a trifling 1.72% per annum.
Let’s see. Who would pay nearly 22X for earnings that are growing at such a tepid rate, and which are also clearly rolling over in the context domestic business cycle that is very long-in-the-tooth and a global deflation cycle that is gathering frightful momentum?
Well, of course, the robo-machines are eager buyers. After all, its hard to get the PE multiple wrong during the course of 10 second holding periods.
So the dumb stock churning machines can be forgiven. But that doesn’t exonerate the borrow and pump carbon units which ostensibly manage America’s top 500 companies.
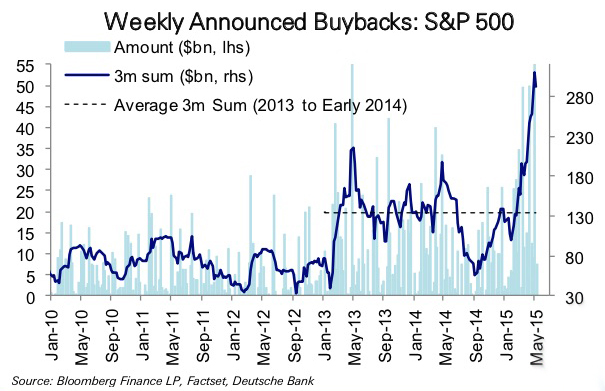
As is shown in the chart below, they announced new stock buyback plans at a $1.2 trillion annual rate in the most recent quarter. They are desperately trying to shrink the share count, hoping to keep the illusion of growth alive just a little longer.
In fact, the corporate game of flooding shareholders with cash via buybacks and dividends has now reached the same fevered peak as late 2007 when companies were distributing every single dime they earned. Thus, during the most recent four-quarters available, the S&P 500 companies reported $880 billion of net income, but flipped $900 billion or 102% of that amount straight into the casino.
That right. Stock buybacks alone accounted for $538 billion or 61% of earnings, and that was one top of $362 billion of dividends during the same 12 month period.
So, yes, in addition to the robo-machines of Wall Street, the greed machines in the C-Suite are also buying shares. But it is pretty evident that whatever lesson they learned from the last stock market meltdown was pushed down the memory hole by the Fed’s endless flood of money.
Indeed, the de facto “put” under the market that kept the gamblers buying the dip over and over since March 2009 has apparently also functioned as an “all-clear” signal to corporate executives and their boards. Thus, during the 4-quarters after the last bottom, the S&P 500 companies bought back only $160 billion of stock, which represented just 30% of net income reported during that period.
Likewise, the combined total of $355 billion of buybacks and dividends amounted to only 65% of net income. That figure did not even amount to 40% of the flood of corporate cash which has surged into the casino in the most recent LTM period.
What this means is that the Fed’s lunatic bubble finance policies are destructively pro-cyclical. As 80 months of ZIRP and $3.5 trillion of debt monetization have systematically falsified prices in the financial markets, the effect has been to lure corporate America into recklessly strip-mining their own balance sheets, thereby goosing the stock average with a final drop-kick of artificial demand.
Needless to say, the Wall Street rationalization that PE multiples are within historic norms is unadulterated non-sense—even for the broad market; and that’s to say nothing about the wildly speculative precincts in tech, social media and biotech where shares trade at 50X, 100X or infinityX.
At nearly 22X reported net income, the S&P index has reached peak bubble lunacy. That’s because this time the Fed and other central banks are out of dry powder. They are stranded at the zero-bound and have demonstrated beyond a shadow of doubt that massive monetization of the public debt does not jump-start growth in an environment of peak debt.
In fact, the global deflation now gathering steam will be knocking those $97.35 of S&P earnings sharply lower in the quarters ahead. That’s because China’s fixed investment, which reached $5 trillion last year and thereby matched the whole of Europe and North America combined, has finally reached the end game.
China’s 20-year frenzy of digging, building, constructing and producing based on a 56X explosion of fiat credit is the root cause of chronic overcapacity worldwide, from shipping, to steel, chemicals and solar panels. And now that global trade is once again shrinking it is only a matter of time before desperate price cutting eviscerates the profits of global corporations.

Moreover, the suzerains of red capitalism in Beijing are in no position to bailout the world economy this time around. That’s because they too are now on the business end of the global dollar short. Chinese companies and speculators have borrowed massively in the off-shore dollar markets—with short term dollar debts at nearly 10% of GDP compared to just 2% at the time of the 2008 financial crisis.

Hans Redeker from Morgan Stanley estimates that short-term dollar liabilities reached $1.3 trillion earlier this year. “This is 9.5pc of Chinese GDP. When short-term foreign debt reaches this level in emerging markets it is a perfect indicator of coming stress. It is exactly what we saw in the Asian crisis in the 1990s,” he said.
In any event, capital outflows have been enormous. During the last six quarters they have totaled nearly $850 billion. This means that for the first time in more than two decades, the People Printing Press of China is being forced to shrink domestic credit—just as the Fed is preparing to normalize dollar denominated interest rates.

The China economic slowdown and initial financial contraction has sent shock waves through commodity markets. The Bloomberg Global Commodity index, which tracks the prices of 22 commodity prices, has now fallen to levels last seen at the turn of the century.


Comments
Log in or sign up to join the conversation.