

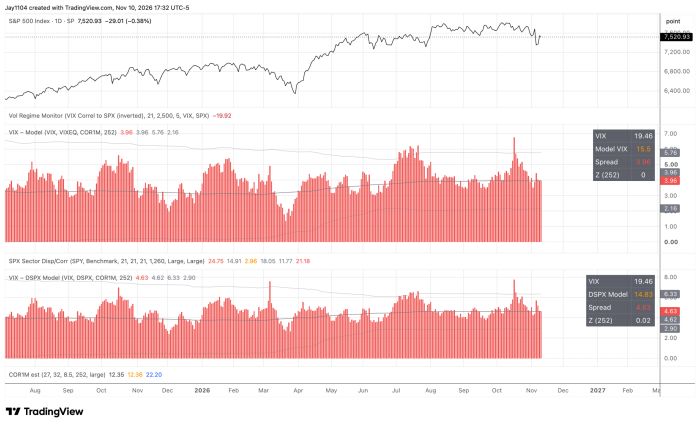
The S&P 500 has spent the past three trading sessions trying to find its footing following the sharp sell-off on November 5. From a volatility standpoint, there is still a little room for the VIX 1-day to decline further after closing today at 13.95. However, there isn’t much volatility premium left to unwind, suggesting the index may have some additional upside, but likely not much.
Meanwhile, the VIX index is roughly where it should be based on single-stock implied volatility, implied correlations, and the dispersion index. That suggests there is limited room for further compression in index-level implied volatility, meaning volatility is unlikely to provide much additional support for a sustained rally.
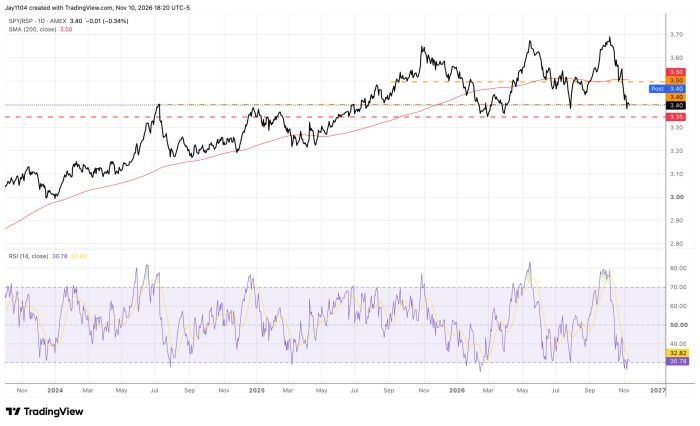
In the meantime, there isn’t much to point to at the index level, except that the SPY-to-RSP ratio is once again approaching a breakdown below support at 3.4. For now, we are still waiting to see which direction the ratio ultimately breaks.
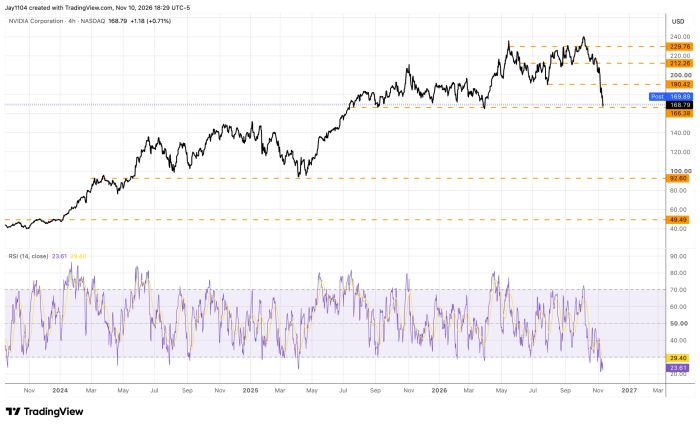
The SPY-to-RSP ratio has largely moved in tandem with Nvidia (NVDA), suggesting that where Nvidia’s stock goes from here will likely play a significant role in determining the ratio’s next move.
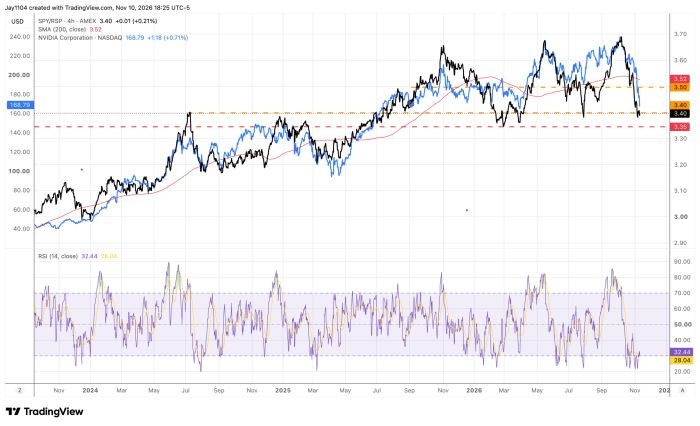
Nvidia is now sitting on the edge, with critical support around $165. A break below that level would likely deal a significant blow to the SPY-to-RSP ratio, potentially pushing it below its own support level. It’s difficult for me to envision a sustained rally in the S&P 500 without Nvidia participating. At this point, where Nvidia goes, the broader market is likely to follow.
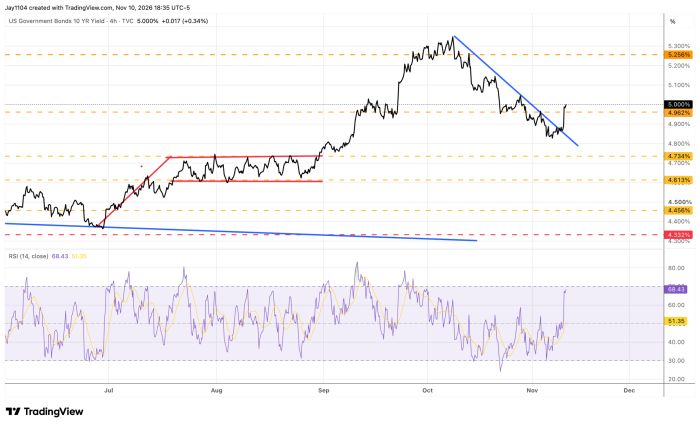
Meanwhile, the 10-year Treasury yield rose sharply today following the hotter-than-expected CPI report, reaching 5%. The move appears to be a clean technical breakout, suggesting yields could continue to climb from here.

Comments
Log in or sign up to join the conversation.