
I have written about bearish divergence in the stock market, the S&P 500 (SPY) in particular, for the past several weeks. When the S&P 500 made new highs, by rule, I had to shave my bearishness down to neutral. Still, my favorite technical indicator, AT40 (T2108), the percentage of stocks trading above their respective 40DMAs, never crossed the overbought threshold (above 70%) and maintained a bearish divergence with the stock market.
Perhaps even more importantly, the currency market flashed even more distinct warnings in the form of a sell-off in AUD/JPY, the Australian dollar (FXA) versus the Japanese yen (FXY) or AUD/JPY. I write often about the importance of AUD/JPY to stock traders; this latest episode confirmed the importance yet again. AUD/JPY surged to a bullish breakout above its 200-day moving average (DMA) on April 12th, but that move quickly turned into a peak. For three weeks, AUD/JPY lost ground almost every single day until this week's bearish breakdown below support that held starting in January.
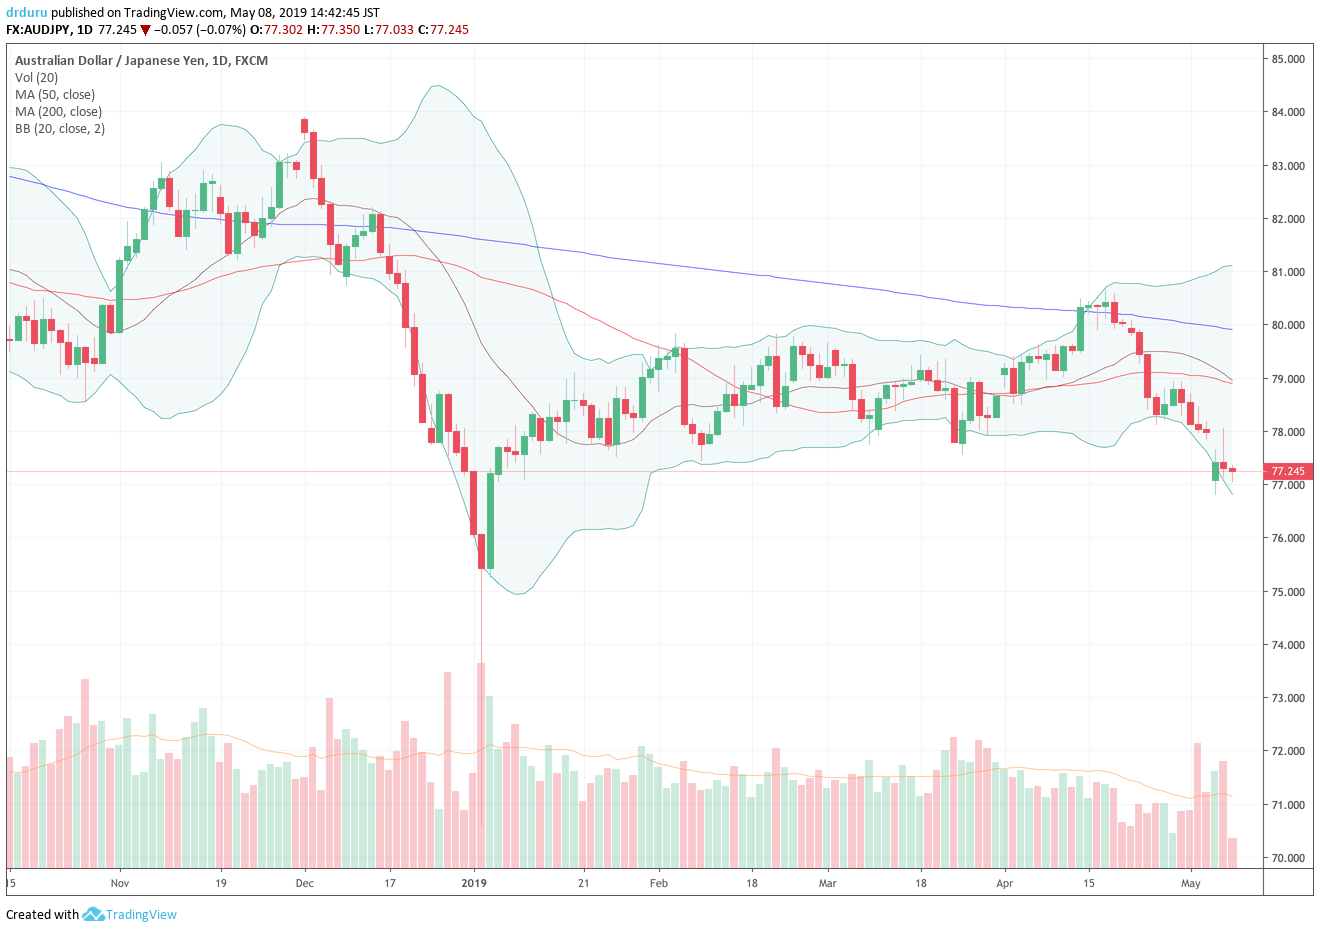
The Australian dollar versus the Japanese yen (AUD/JPY) suffered a bearish breakdown to start this week...just over three weeks since a very bullish breakout.
Source: TradingView
While AUD/JPY was losing altitude, the S&P 500 continued to float higher until its last all-time high last Friday. That high was very marginal as it beat the previous high by a hair. Notably, the index closed today below the April 12th level where AUD/JPY peaked.
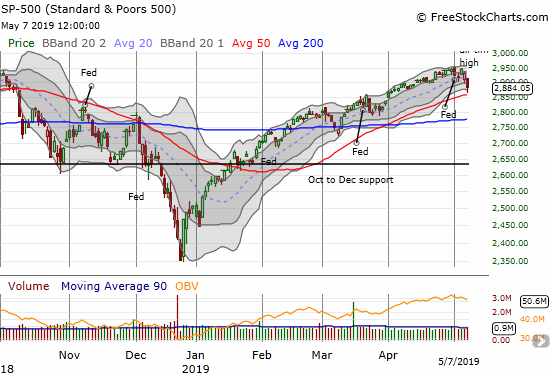
The S&P 500 (SPY) abruptly fell from its all-time high and almost tested uptrending support from its 50DMA.
Source: FreeStockCharts
So what now? AUD/JPY still looks weak and seems ready to challenge levels last seen during the early January flash crash. I am not anticipating a repeat of that calamitous period, but I am expecting on-going weakness and a sustained top in the S&P 500. As usual, I will be relying on AT40 to flag conditions oversold enough to warrant some dip buying. In the meantime, I continue to hold AUD/JPY long as one of my hedges against short positions in the stock market.
The volatility index, the VIX, presents an important wildcard. The VIX, experienced significant surges the last two trading days - as much as 46% on Monday and as much as 41% on Tuesday. The market rarely sustains these kinds of outsized moves for long except in the midst of a, particularly virulent bear market. In other words, selling pressure may have already started its exhaustion phase soon after revving up the engines. A large implosion in volatility (bigger than the fades from the highs of the last two days) should signal the completion of the exhaustion process.
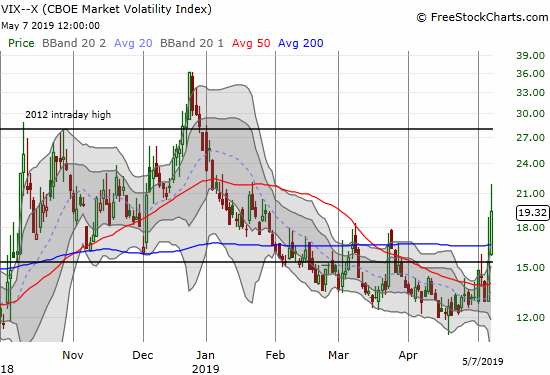
The volatility index (VIX) followed up from last week's eruption with two tremendous surges the last two days. Can the market sustain this eruption from complacency?
Source: FreeStockCharts

Comments
Log in or sign up to join the conversation.