

As the title of this morning's report indicates, the condition of the Early Warning board is largely unchanged. It is clear that stocks are overbought, and it can easily be argued that "the table is set" for some downside action. However, I continue to believe that stocks are currently entrenched in what I call a "good overbought" condition. So, until the bears can come up with a raison d'etre for more than a day or two here and there, I will continue to give the bulls the edge and opine that a "buy the dip" strategy remains appropriate.
The State of the "Early Warning" Indicators
As a reminder, I believe one of the keys to longevity in the investing business is having a repeatable process. Thus, I start each week with a review of the state of the big-picture environment. I then look at the current trend and the degree of momentum behind the move. Next, I explore the potential for a countertrend move to develop via our Early Warning Indicator Board, which is designed to indicate when "the table might be set" for the trend to "go the other way" for a while.
In looking at the Early Warning board, my take is the odds for some downside price action are elevated (note that none of the indicator gauges are in the green zone). However, it is important to recognize that our furry friends have had the table set for them for some time now and have not been able to do get anything going. So, although the market remains overbought and the board continues to favor some countertrend action I'm giving the bulls the benefit of doubt here.
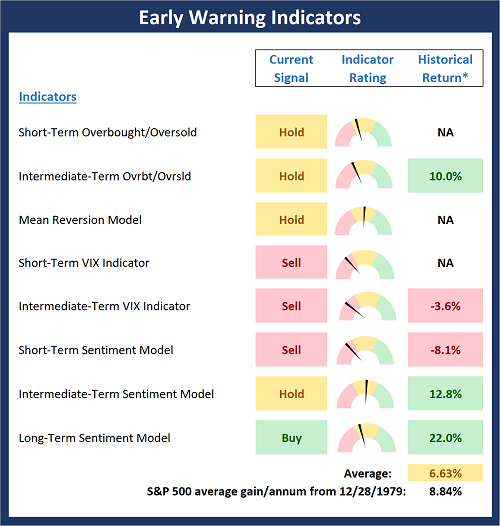
* Source: Ned Davis Research (NDR) as of the date of publication. Historical returns are hypothetical average annual performances calculated by NDR. Past performances do not guarantee future results or profitability - NOT INDIVIDUAL INVESTMENT ADVICE.
Stochastic Review
Over the years, I have found that reviewing the basic stochastics is a solid way to determine when an index or security may be ripe to "go the other way" for a while. I like to keep it simple here by using a 14 day %K (with 1-day smoothing) and a 3-day %D. It's not fancy, but it tends to be an effective tool for an oftentimes complex subject.
S&P 500 - Daily
(Click on image to enlarge)
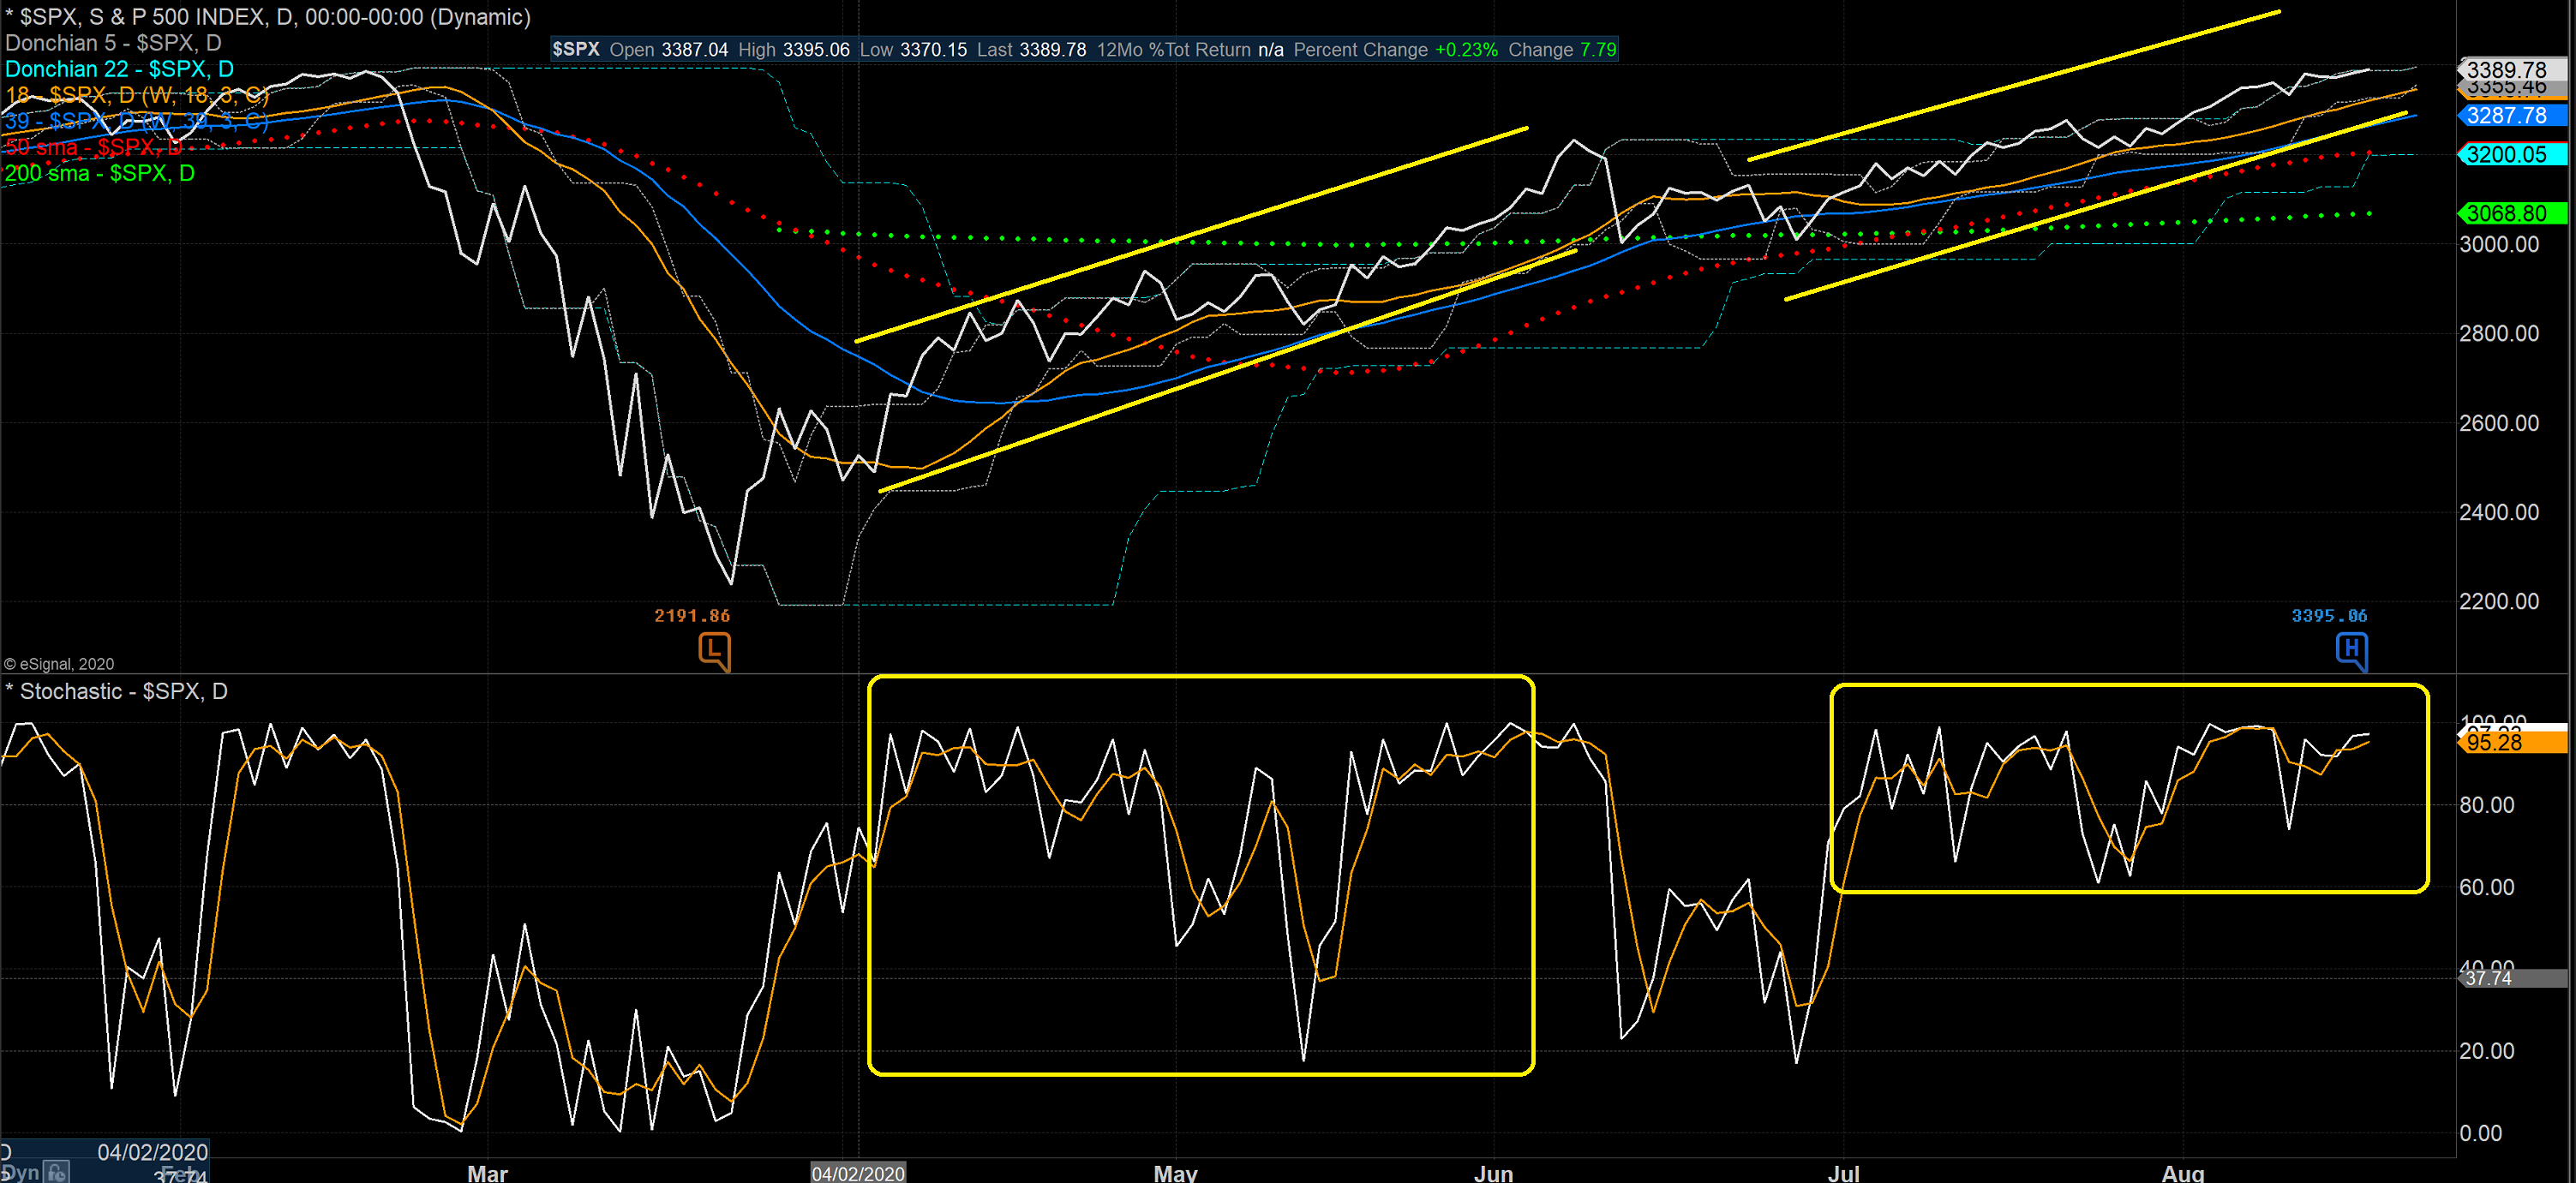
The song remains the same here too as the stochastics suggest that we have a "good overbought" condition on our hands. As can be seen on the chart, the S&P has been unable to create any sort of oversold condition since early July. And while this can easily change at the drop of a headline/algo, I'm going to need to see more than a brief dip into oversold territory to get me off the bull train/trend.
Yes, the "good overbought" condition will end at some point - they always do. Something always comes along to convince the "fast money" to do some selling. But when it does, it will be important to see if the selling lasts more than a day or two. If not, then the "good overbought" condition will remain in place and the dip will represent another opportunity to add exposure.
Publishing Note: I have an early commitment tomorrow morning and will not publish a report.
Thought For The Day:
The time of maximum pessimism is the best time to buy, and the time of maximum optimism is the best time to sell. -Sir John Templeton



Comments
Log in or sign up to join the conversation.