

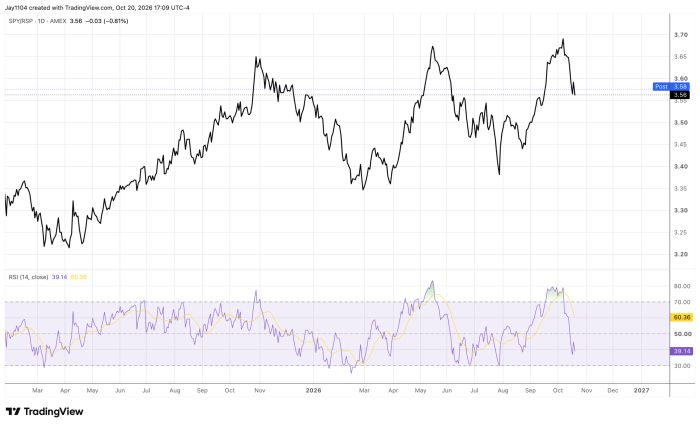
Markets were fairly boring again today, with little happening on the surface but plenty happening beneath. The RSP outperformed the SPY, pushing the SPY-to-RSP ratio lower. This suggests market leadership is shifting away from the mega-cap technology stocks that have driven much of the market’s gains toward a broader group of stocks. If this trend continues, the equal-weighted S&P 500 could outperform the tech-heavy SPY.
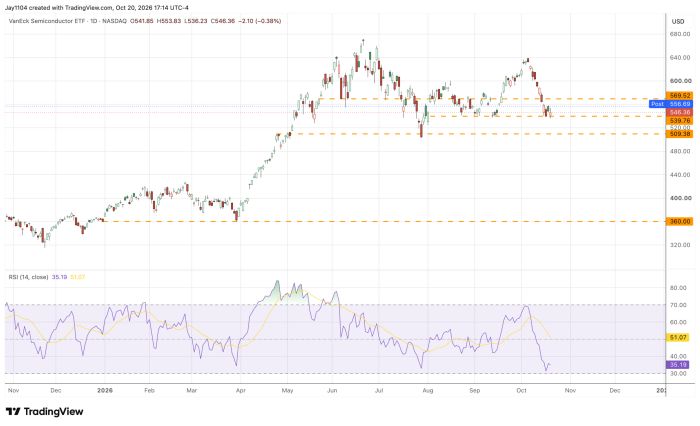
The SMH remains at a critical level, with support around $540 having held firm for some time. A break below that level could trigger a sharper decline and open the door to a retest of the July lows near $510.
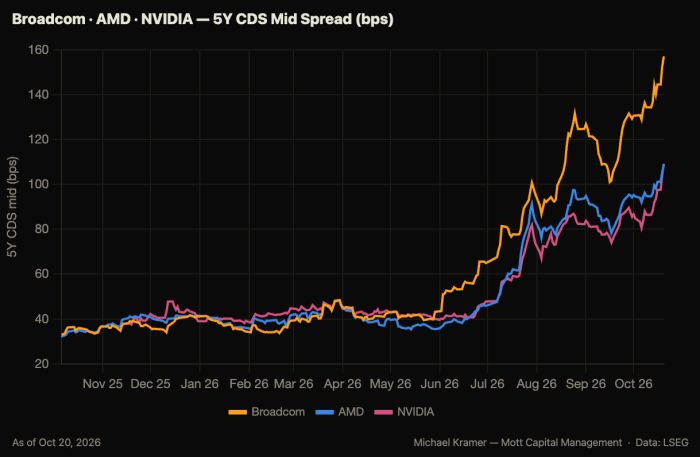
That makes sense, given that credit default swap spreads continue to widen for semiconductor companies, with Nvidia (NVDA), AMD (AMD), and Broadcom (AVGO) widening further today. Typically, widening CDS spreads signal rising credit risk, which tends to put downward pressure on stock prices. That relationship has largely played out for Broadcom, but less so for AMD and Nvidia, although both stocks have recently started to weaken as well.
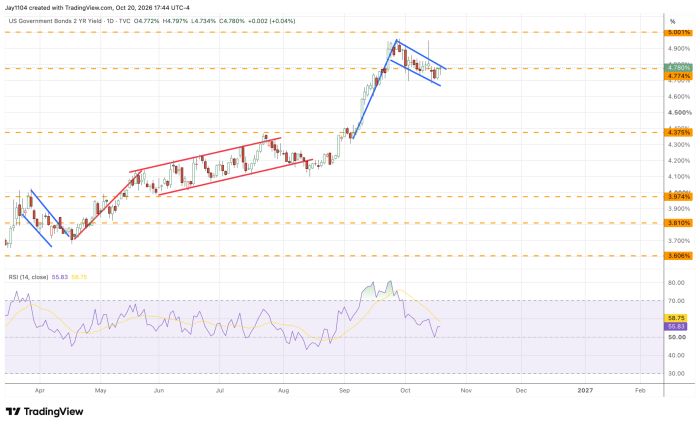
The 2-year Treasury yield appeared to be forming a bull flag ahead of the CPI report and briefly broke out before giving back the entire move. Now, the pattern appears to be taking shape again. This time, any breakout would need to hold. If it does, I think we could see the 2-year yield rise to 5% or higher.
Maybe tomorrow will be interesting.



Comments
Log in or sign up to join the conversation.