


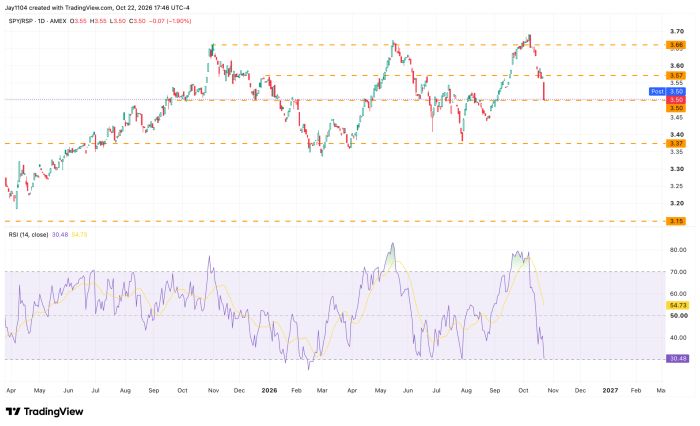
It looked like a rough day for stocks, with the S&P 500 down more than 1% and the Nasdaq down almost 3%. However, the RSP, the equal-weight S&P 500 ETF, was up more than 70 basis points. This ties back to what we discussed a week or two ago about a potential rotation in the market, given the triple-top pattern forming in the SPY-to-RSP ratio. So far, the pattern hasn’t fully played out, and I’m guessing we could see the ratio move even lower.
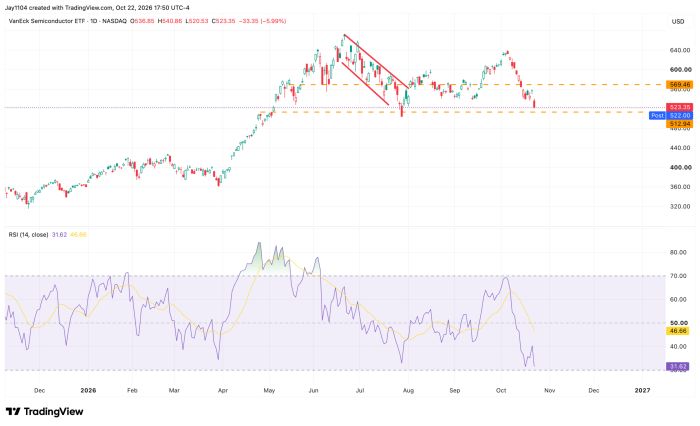
The SMH was down sharply and is nearing its July lows, which appear to be an important support level. If that level breaks, I could imagine it creating a bigger problem for the entire market, given how momentum-driven it has been.
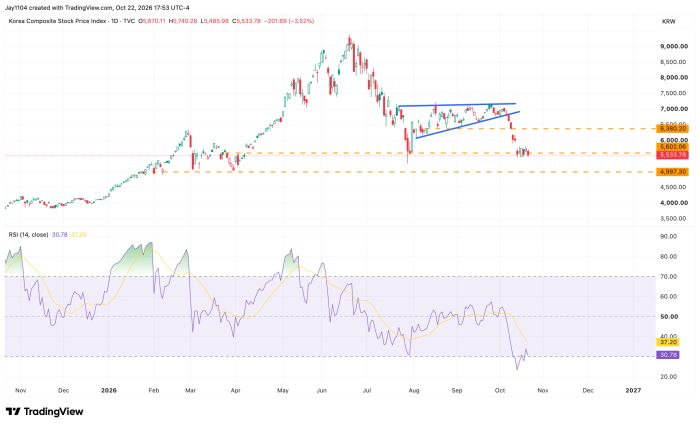
The KOSPI shows this a bit better, and to be fair, it has been an excellent leading indicator for the SMH. So tonight may very well determine whether or not the sector breaks down. The KOSPI chart looks really bad, and I would not be surprised at all if it fell further.



Comments
Log in or sign up to join the conversation.