

What is technical analysis for forex trading?
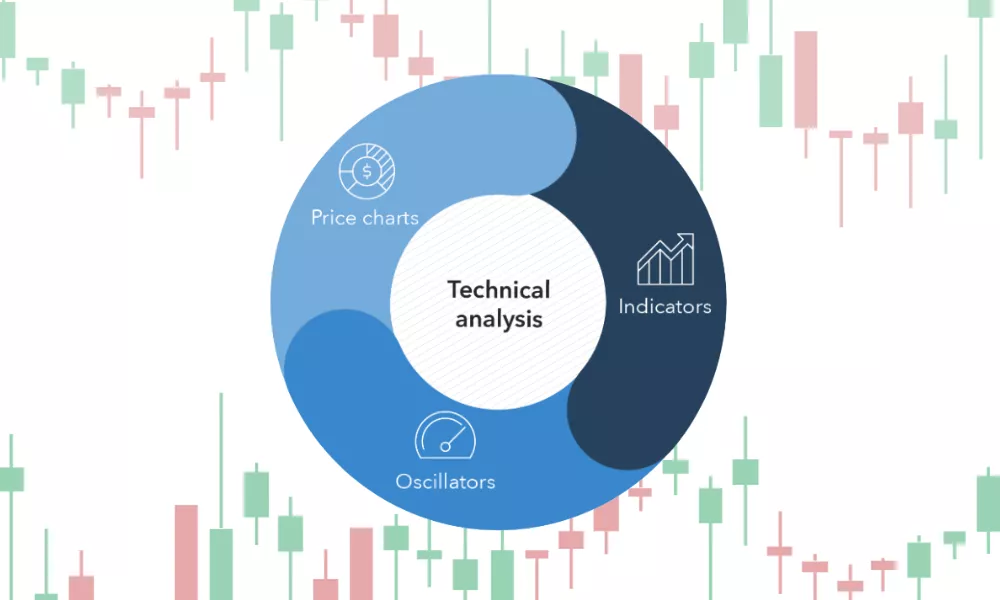
Technical analysis is an approach to forex trading that involves analyzing past market data, such as price charts and trading volumes, to make predictions about future market movements. The central premise of technical analysis is that market trends, patterns, and price movements tend to repeat themselves over time. By studying these patterns and trends, traders can identify potential opportunities to enter and exit trades.
Some common tools and techniques used in technical analysis for forex trading include:
Charts: Technical analysts use price charts to identify patterns and trends in the market. These charts may include different timeframes, such as daily, weekly, or monthly charts.
Indicators: Technical analysts use a variety of indicators, such as moving averages, oscillators, and momentum indicators, to analyze market data and identify potential trading opportunities.
Candlestick patterns: Technical analysts may use candlestick charts to identify patterns in price movements and predict potential market reversals.
Support and resistance levels: Technical analysts look for levels of support and resistance in the market, which can indicate potential buy or sell signals.
Overall, technical analysis is a widely used approach to forex trading that can provide valuable insights into market trends and potential trading opportunities. However, it is important to note that technical analysis should be used in conjunction with other forms of analysis, such as fundamental analysis and risk management strategies, to make informed trading decisions.
Example of Technical analysis for forex trading
Here's an example of how technical analysis can be used in forex trading:
Let's say a trader is analyzing the EUR/USD currency pair using a daily price chart. The trader notices that the price of EUR/USD has been in a downtrend for the past few weeks and is currently trading at a key support level.
The trader decides to use the Relative Strength Index (RSI), which is a momentum indicator, to confirm their analysis. They notice that the RSI is also showing that the market is oversold, which suggests that a potential price reversal could be on the horizon.
The trader decides to enter a long position on the EUR/USD currency pair, anticipating that the price will rebound from the support level and start to move higher.
To manage risk, the trader sets a stop-loss order just below the support level, in case the market continues to move lower. They also set a profit target at a key resistance level, where they expect the price to encounter selling pressure.
As the market moves higher over the next few days, the trader closely monitors the price action and adjusts their stop-loss and profit target levels as needed. Finally, when the price reaches their profit target, the trader exits the trade with a profit.
In this example, the trader used technical analysis to identify a potential trading opportunity, confirm their analysis using an indicator, and manage risk using stop-loss and profit target orders.
[Note: Since 2018, I've become a forex trader. I always use technical analysis before trading. I wanted to avoid mistakes when dealing with AssetsFX and other platforms. As a trader, I recommend getting forex education and applying it to your trading.]
Types of Technical analysis for forex trading
There are several types of technical analysis that traders use in forex trading. Here are some of the most common types:
Chart patterns:
Chart patterns are visual representations of price movements that traders use to predict future market movements. Some common chart patterns include head and shoulders, double tops and bottoms, and triangles.
Indicators:
Technical analysts use indicators to analyze market data and identify potential trading opportunities. These can include moving averages, oscillators, and momentum indicators.
Japanese candlesticks:
Japanese candlesticks are a type of chart used in technical analysis that shows the price movement of an asset over a period of time. Candlesticks are used to identify patterns, such as doji or engulfing patterns, which can indicate potential changes in market direction.
Elliott Wave Theory:
This is a technical analysis approach that uses wave patterns to identify potential market movements. The theory proposes that market trends move in a series of five waves, with three in the direction of the trend and two against it.
Fibonacci retracements:
Fibonacci retracements are a tool used in technical analysis to identify potential levels of support and resistance in the market. These levels are based on mathematical ratios derived from the Fibonacci sequence.
Gann analysis:
Gann analysis is a technical analysis approach that uses geometric patterns to identify potential market movements. This approach involves using charting tools to identify key levels of support and resistance and predicting market movements based on these levels.
Overall, each type of technical analysis has its own strengths and weaknesses, and traders may use a combination of these approaches to make informed trading decisions. It's important to note that no single approach can guarantee success in forex trading, and traders should always use risk management strategies to protect their investments.
Benefits of Technical analysis for forex trading
There are several benefits of using technical analysis for forex trading, including:
Identifying trends:
Technical analysis allows traders to identify trends in the market, which can provide insight into potential market movements. By identifying trends, traders can make informed decisions about when to enter or exit trades.
Objective analysis:
Technical analysis is a data-driven approach to trading, which means that it is based on objective data rather than subjective opinions. This can help traders avoid emotional biases and make more rational decisions.
Historical data:
Technical analysis uses historical market data to make predictions about future market movements. By analyzing past market trends and patterns, traders can identify potential opportunities and make more informed trading decisions.
Easy to use:
Technical analysis tools, such as charts and indicators, are easy to use and widely available. This means that traders of all experience levels can use technical analysis to improve their trading strategies.
Risk management:
Technical analysis can help traders manage risk by identifying potential levels of support and resistance in the market. By using stop-loss and profit target orders, traders can limit their losses and protect their investments.
Drawbacks of Technical analysis for forex trading
While technical analysis is a popular approach to forex trading, there are some potential drawbacks to consider, including:
False signals:
Technical analysis relies on the interpretation of historical price data to make predictions about future market movements. However, there is always the risk of false signals, where market movements do not follow the predicted pattern.
Lagging indicators:
Some technical indicators, such as moving averages, are considered lagging indicators, meaning they reflect past market movements rather than current market conditions. This can lead to delays in identifying potential market movements and may result in missed opportunities.
Limited scope:
Technical analysis only considers price movements and does not take into account external factors, such as economic data or news events. This means that technical analysis may not provide a complete picture of market conditions and may not be sufficient for making informed trading decisions.
Over-reliance:
Some traders may become over-reliant on technical analysis and fail to consider other forms of analysis, such as fundamental analysis. This can lead to missed opportunities or unexpected losses.
Interpretation issues:
Technical analysis can be subject to interpretation, which means that different traders may come to different conclusions about the same data. This can lead to confusion and may make it difficult to make informed trading decisions.
Why do we need Technical analysis for forex trading?
Technical analysis is a popular approach to forex trading because it provides traders with valuable insights into market movements and potential trading opportunities. Here are some reasons why traders may use technical analysis in their forex trading:
Identify trends: Technical analysis allows traders to identify trends in the market, which can provide insight into potential market movements. By identifying trends, traders can make informed decisions about when to enter or exit trades.
Forecast potential price movements: Technical analysis uses historical price data to identify potential patterns in market movements. By using this data, traders can make informed predictions about future market movements and adjust their trading strategies accordingly.
Provide objective data: Technical analysis is a data-driven approach to trading, which means that it is based on objective data rather than subjective opinions. This can help traders avoid emotional biases and make more rational decisions.
Manage risk: Technical analysis can help traders manage risk by identifying potential levels of support and resistance in the market. By using stop-loss and profit target orders, traders can limit their losses and protect their investments.
Improve trading strategies: Technical analysis provides traders with valuable information about market conditions, which can help them improve their trading strategies. By using technical analysis, traders can identify potential opportunities and adjust their strategies to make more informed trading decisions.
Conclusion
In conclusion, technical analysis is a popular approach to forex trading that involves the use of historical price data and technical indicators to identify potential market movements and trading opportunities. While there are some potential drawbacks to using technical analysis, such as false signals and over-reliance, it is a valuable tool that can provide traders with objective data, help manage risk, and improve trading strategies.
To use technical analysis effectively, traders need to have a strong understanding of technical indicators, chart patterns, and other key concepts. They also need to be able to interpret market data and adjust their trading strategies as market conditions change.
While technical analysis is a valuable approach to forex trading, it is important to recognize its limitations and use it in conjunction with other forms of analysis, such as fundamental analysis and risk management strategies. By combining different approaches to analysis, traders can make more informed decisions about when to enter or exit trades and manage risk effectively.
Comments
Log in or sign up to join the conversation.