
Using core CPI, Cleveland Fed nowcasts for June, and July, as of 7/7.
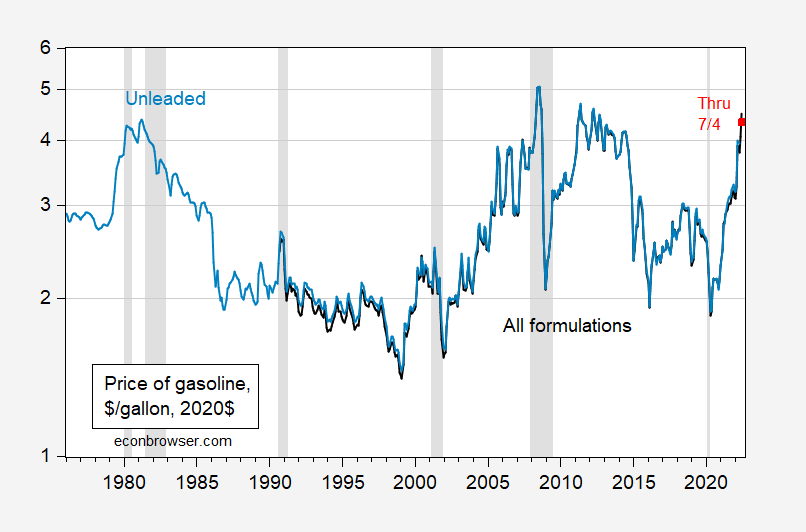
Figure 1: Price of gasoline, all formulations (black), and of gasoline, unleaded (blue), in 2020$, using core CPI as deflator. NBER defined peak-to-trough recession dates shaded gray. July observation uses gasoline prices through 7/4. June, July observations use Cleveland Fed nowcasts for core CPI as of 7/7. Source: EIA via FRED, BLS, Cleveland Fed.
Gasoline prices are high in relative terms, but not at record highs. That was in 2008.
More By This Author:
Inflation Expectations At The 5-Year Horizon
Gasoline Prices Today And (Maybe) Tomorrow
Did Oil Prices Start Rising When Biden Started His War On Fossil Fuels


Comments
Log in or sign up to join the conversation.