


Two 50%+ drawdowns for the stock market within a decade of each other made the traditional "60/40" portfolio of 60% stocks and 40% bonds an easy sell after the Financial Crisis. But stocks have left 60/40 in the dust after nearly two decades of equity market gains and a struggling fixed income market since the post-COVID inflation surge.
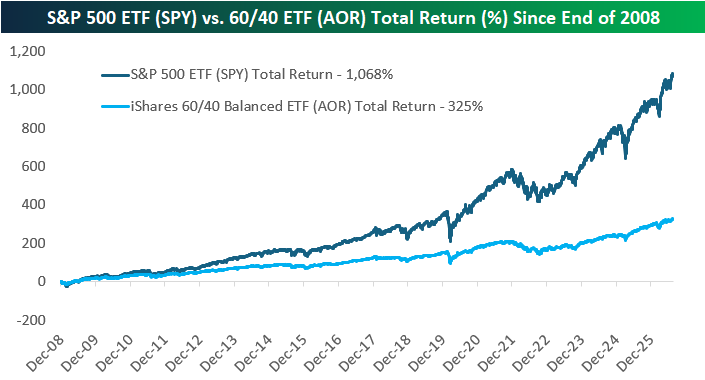
Below is a chart showing the total return of the S&P 500 ETF (SPY) versus the iShares 60/40 ETF (AOR) since the end of 2008. AOR is up 325%, but SPY has been a 10-bagger.
Part of maintaining a balanced portfolio to spread out risk and reduce volatility is rebalancing on a regular basis.
Below is a chart showing how a hypothetical portfolio of 60% SPY and 40% AGG (the aggregate bond market ETF) would have done since the end of 2008 with monthly rebalancing. At the beginning of each month, SPY and AGG are either sold or bought to get the weighting back to a 60/40 split.
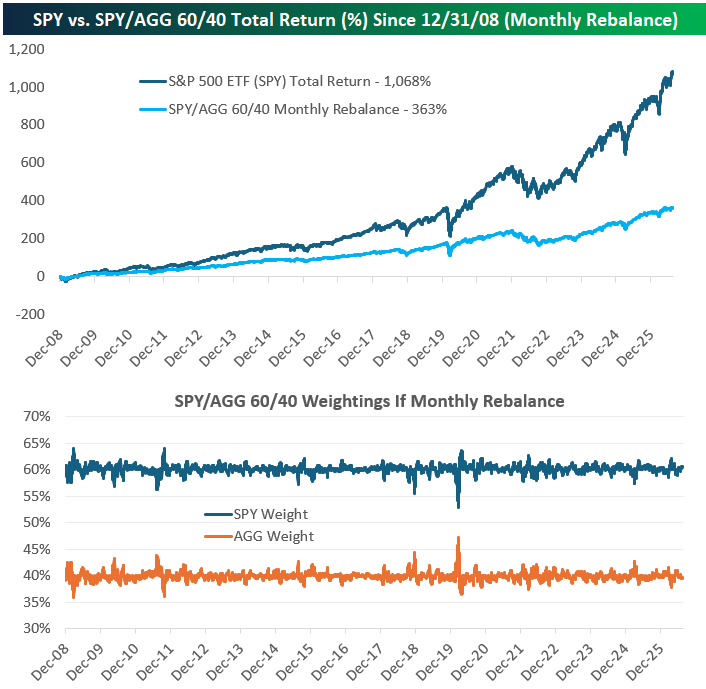
With monthly rebalancing, neither SPY nor AGG can ever get too far out of whack from the 60/40 target. As shown in the second chart above, the COVID Crash for stocks in March 2020 caused the biggest intra-month weighting divergence, but even then, it never got more extreme than a 55/45 split.
An even more passive approach for the traditional 60/40 portfolio is to rebalance annually. Below we show the hypothetical performance of 60/40 (SPY/AGG) with a rebalance on the first trading day of each year since the end of 2008.
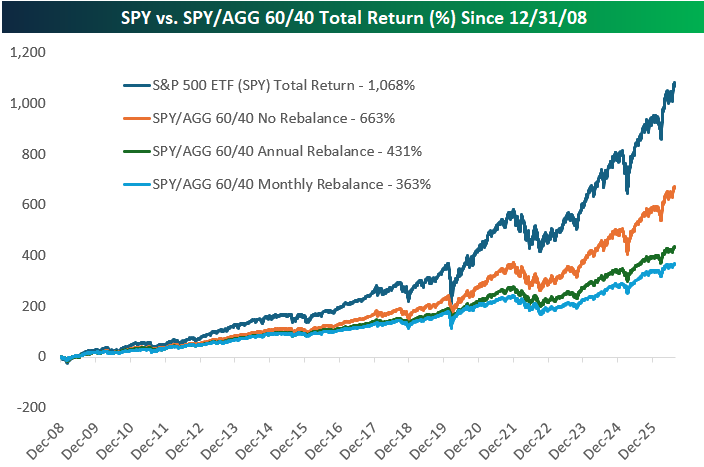
Because stocks have so consistently outperformed bonds since the Financial Crisis, an annual rebalance for 60/40 has outperformed a monthly rebalance by quite a bit (431% for the annual rebalance versus 363% for the monthly rebalance).
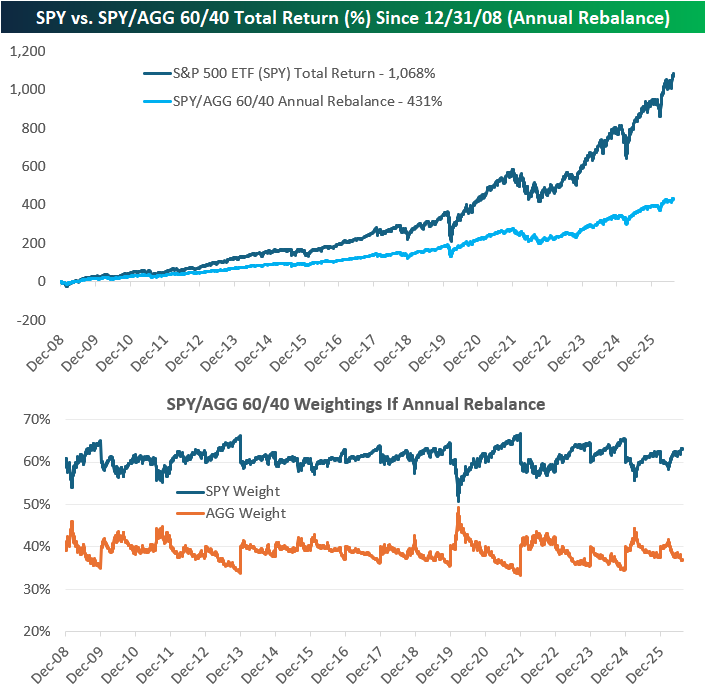
As shown in the second chart above, the weightings for SPY and AGG move around much more with an annual rebalance, but even still, a 60/40 starting point at the start of each year since the end of 2008 would never have dipped below 50/50 on any trading day.
Market dynamics since the Financial Crisis have made it so that no rebalancing at all for 60/40 would have made an investor a lot more money over the years.
Below we show how a hypothetical portfolio would have done if you simply put 60% into SPY and 40% into AGG on the last day of 2008 and held through today. While 60/40 with annual rebalancing would have returned 431%, no rebalancing at all would have returned 663%.
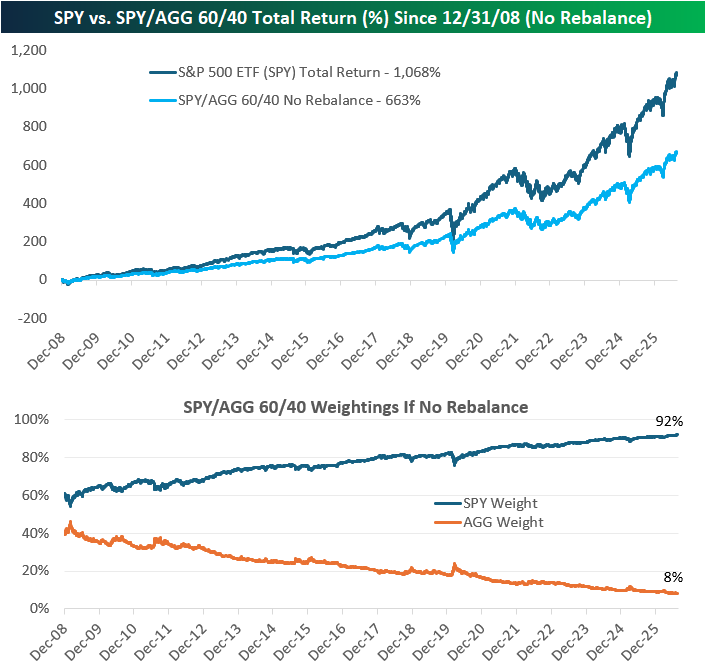
Incredibly, the "no rebalance" 60/40 portfolio at the end of 2008 would leave you with a portfolio that is 92% SPY and just 8% AGG today!
Even with higher yields, fixed income is about as unloved of an asset class as you'll find right now given its underperformance since 2021. At the same time, investors seem to be allocating more and more into equities because of their extremely strong returns. Always remember that nothing lasts forever, though. There's an old saying that the market exists to cause the most amount of pain for the most number of investors, and if that's the case, the over-exposure to stocks is bound to cause a lot of pain when the trend of the last 17+ years comes to an end.


Comments
Log in or sign up to join the conversation.