

Friday morning, the Census Bureau posted the Advance Report on the latest Durable Goods New Orders. This series dates from 1992 and is not adjusted for either population growth or inflation.
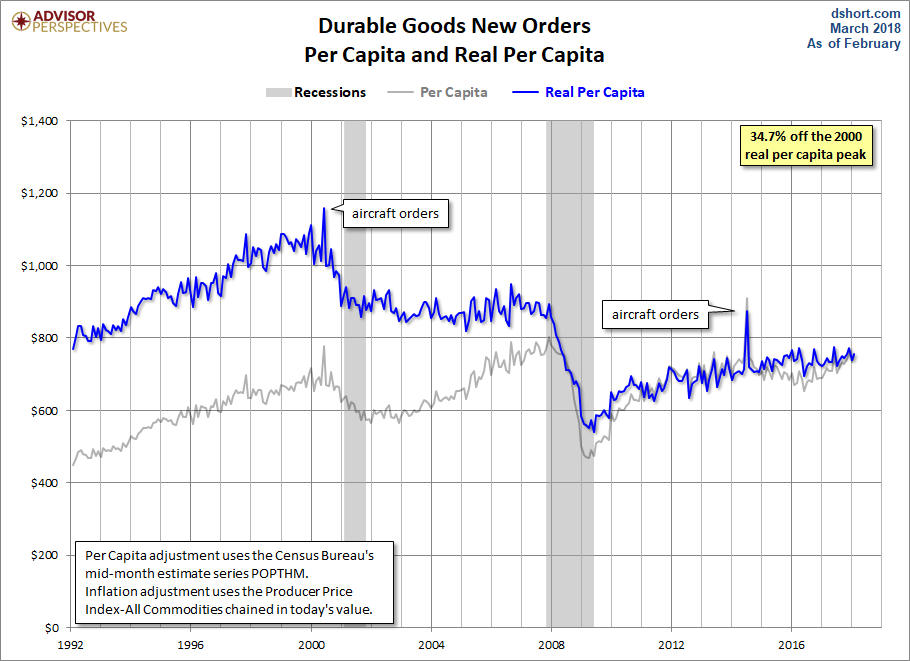
Let's now review Durable Goods data with two adjustments. In the charts below the gray line shows the goods orders divided by the Census Bureau's monthly population data, giving us durable goods orders per capita. The blue line goes a step further and adjusts for inflation based on the Producer Price Index for All Commodities, chained in today's dollar value. This gives us the "real" durable goods orders per capita and thus a more accurate historical context in which to evaluate the conventional reports on the nominal monthly data.
We've included a callout in the upper right corner to document the decline of the latest month from the all-time peak for the series.
(Click on image to enlarge)
Economists frequently study this indicator excluding Transportation or Defense or both. Just how big are these two subcomponents? Here is a stacked area chart to illustrate the relative sizes over time based on the nominal data. We've also included a dotted line to show the relative size of the Core Capex subset, which we'll illustrate in more detail below.
(Click on image to enlarge)

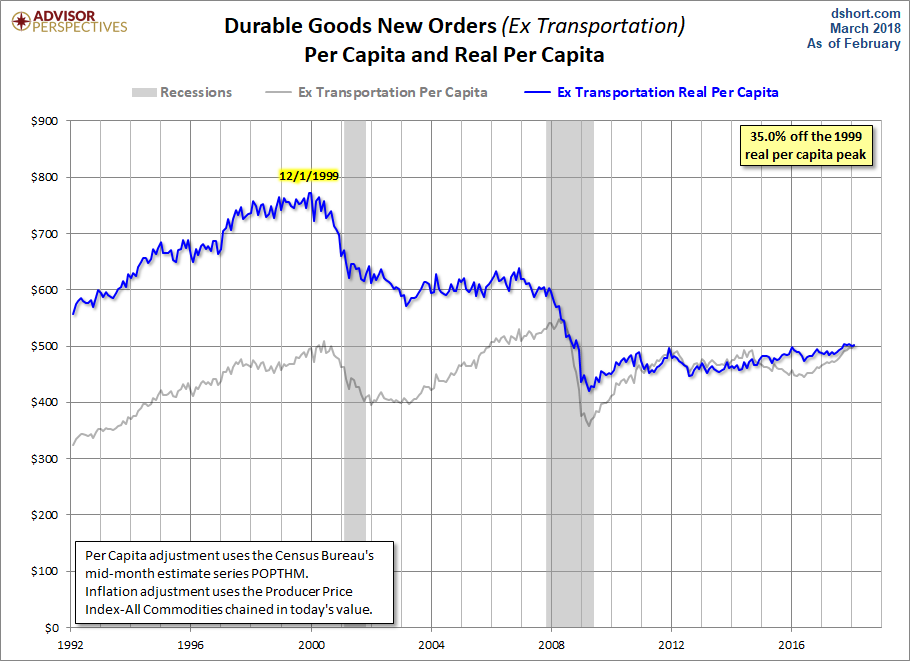
The next chart is similar to the first one except that it excludes the volatile Transportation component, the series usually referred to as "core" durable goods.
(Click on image to enlarge)
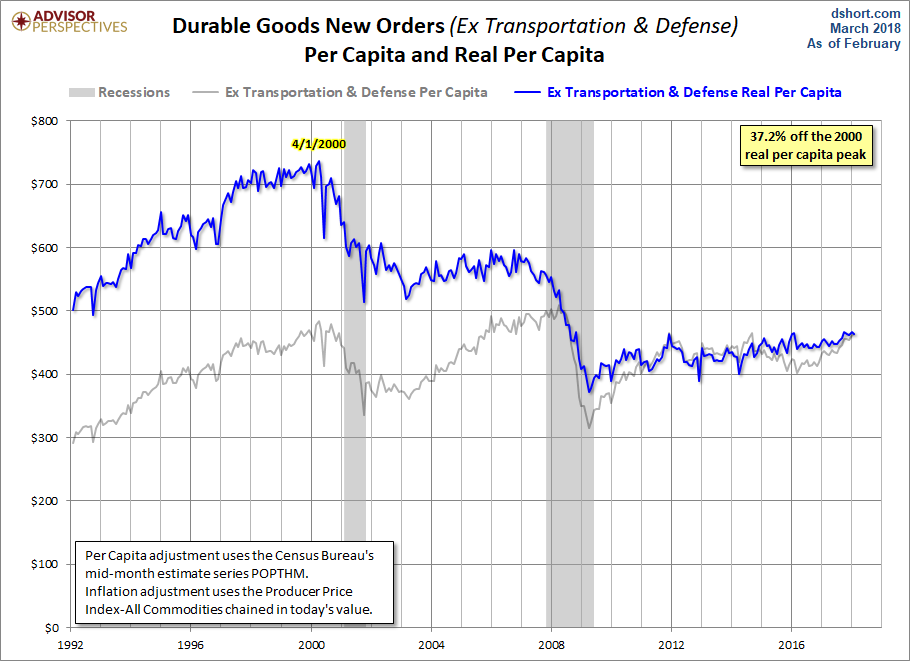
Now we'll exclude both Transportation and Defense for a better look at a more concentrated "core" durable goods orders.
(Click on image to enlarge)
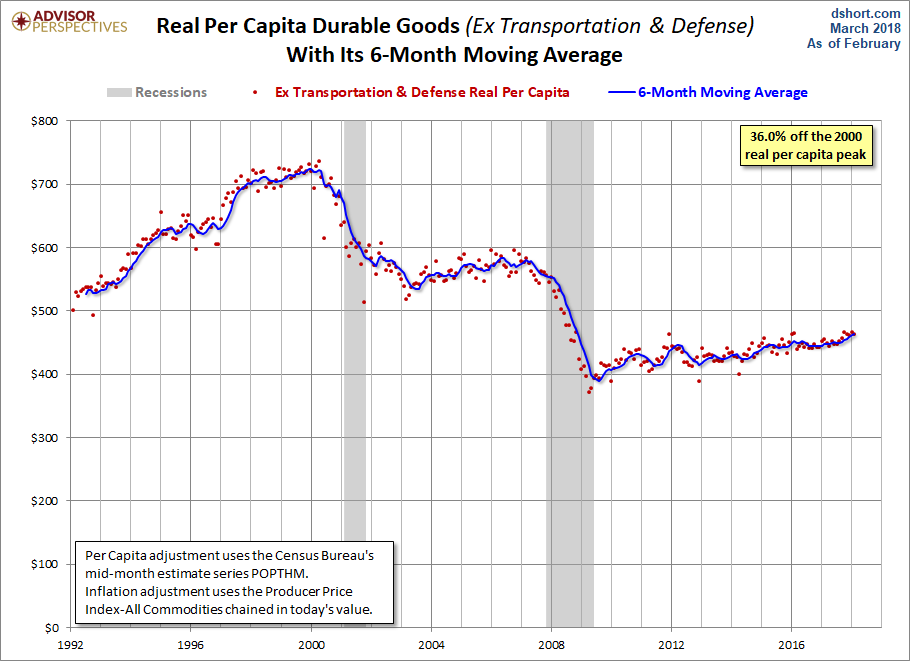
Here is the chart that gives the most accurate view of what Consumer Durable Goods Orders is telling us about the long-term economic trend. The six-month moving average of the real (inflation-adjusted) core series (ex-transportation and defense) per capita helps us filter out the noise of volatility to see the big picture.
(Click on image to enlarge)
Capital Goods
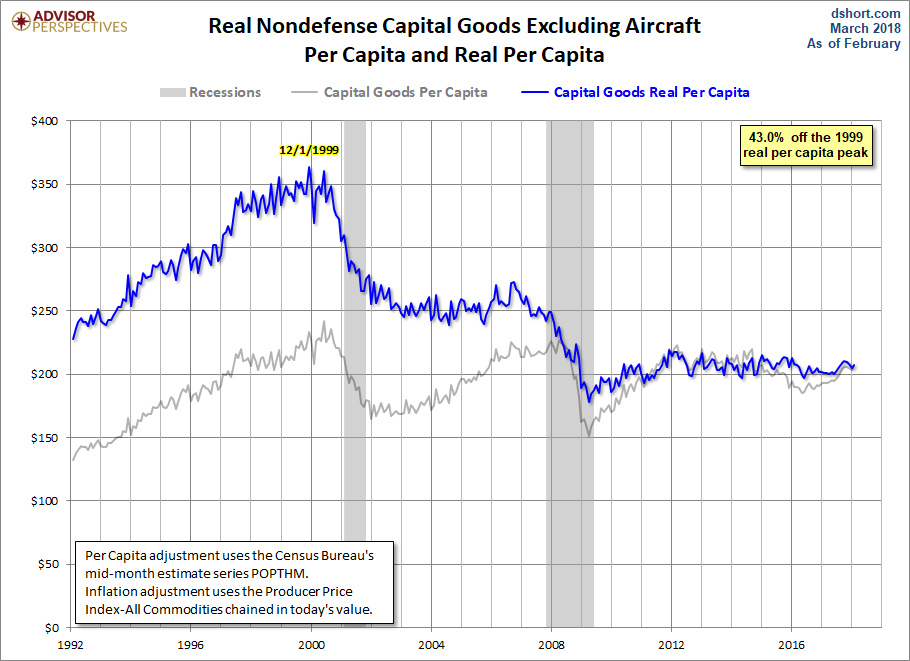
Finally, let's take a big step back in the sales chain and look at the popular series often referred to as Core Capex — Nondefense Capital Goods New Orders Excluding Aircraft (capital goods are durable goods used in the production of goods or services), shown here on a per-capita basis, nominal and real.
(Click on image to enlarge)
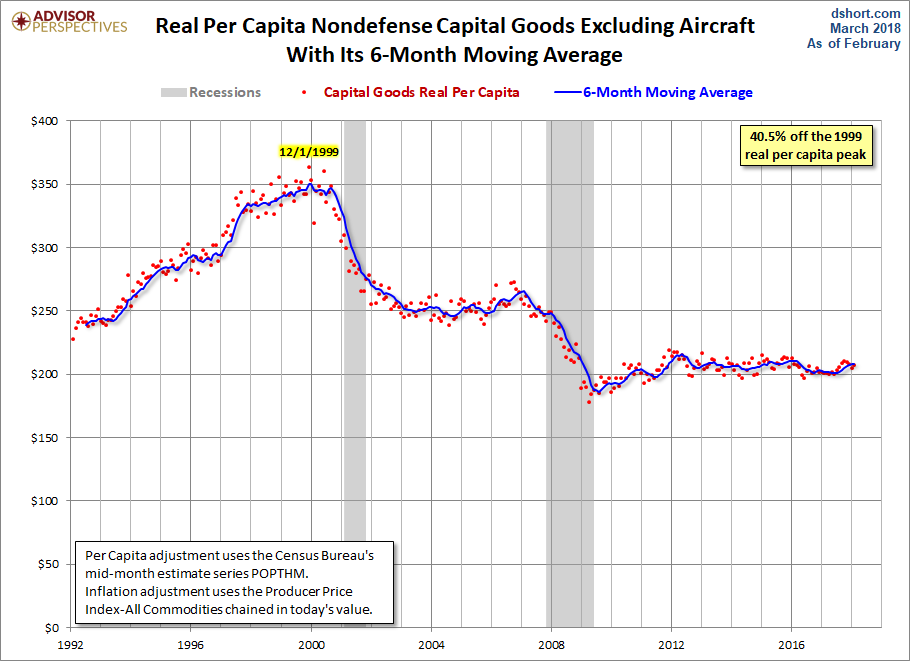
Here is the real per-capita Core Capex smoothed with its six-month moving average for a better sense of the trend. This metric has essentially gone nowhere over the past five years.
(Click on image to enlarge)



Comments
Log in or sign up to join the conversation.