

As we have commented in our previous analyses, the increase in inflation is possibly one of the biggest concerns facing the financial markets currently. The different Central Banks have been trying to keep the markets calm with optimistic messages that this inflation is only temporary and will not affect the markets more seriously in the future, but what if the black swan that the markets are waiting for is not inflation but the energy crisis?
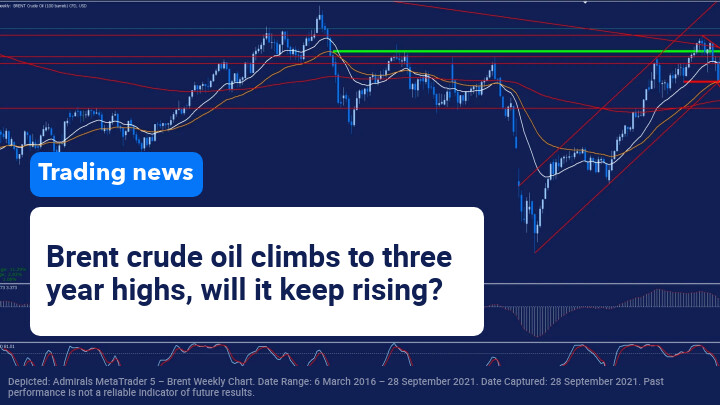
It is obvious that the rising cost of energy is a major factor affecting the rise in inflation, but as the weeks go by and the autumn and winter period approaches in the northern hemisphere, not only is the cost of energy and electricity getting more expensive, but the price of oil has been slowly climbing to levels not seen since October 2018.
Putting aside the long queues at petrol stations in the United Kingdom, the cost of energy prices in Europe is escalating to record highs. This follows record highs in the price of electricity due to, amongst other things, the sharp increase in the prices of natural gas, oil and the progressive abandonment of coal.
Although the European Union is trying to progressively reduce its dependence on fossil fuels, for the moment the generation of energy through renewables is not capable of supplying current demand. Therefore, this change is causing an energy crisis that is not only affecting the financial markets but is also affecting families and, therefore, consumers.
But at this point, the biggest current concern in relation to the energy crisis is clearly China. In recent days the Asian giant has begun to feel the consequences of the global energy crisis and the Beijing government has begun to ration electricity consumption in an attempt to reduce prices and emissions.
China is carrying out a series of reforms to try and achieve a more sustainable and egalitarian economy and, to this end, it is focusing on energy control. At the moment, some of the areas most affected by this energy rationing are the areas of Jiangsu, Zhejiang and Guangdong, which are important industrial hubs. This has resulted in some factories being closed, affecting suppliers of giants such as Apple and Tesla and adding to the existing crisis caused by the shortage of microchips.
Therefore, it seems that a perfect storm is forming for the months ahead, which is supporting the oil price rises. The Brent barrel, as we can see in the weekly chart, has surpassed 80 dollars, thus continuing the important upward channel that began with the lows at the beginning of the pandemic, despite the attempts by China and the United States to try to contain the price.
(Click on image to enlarge)
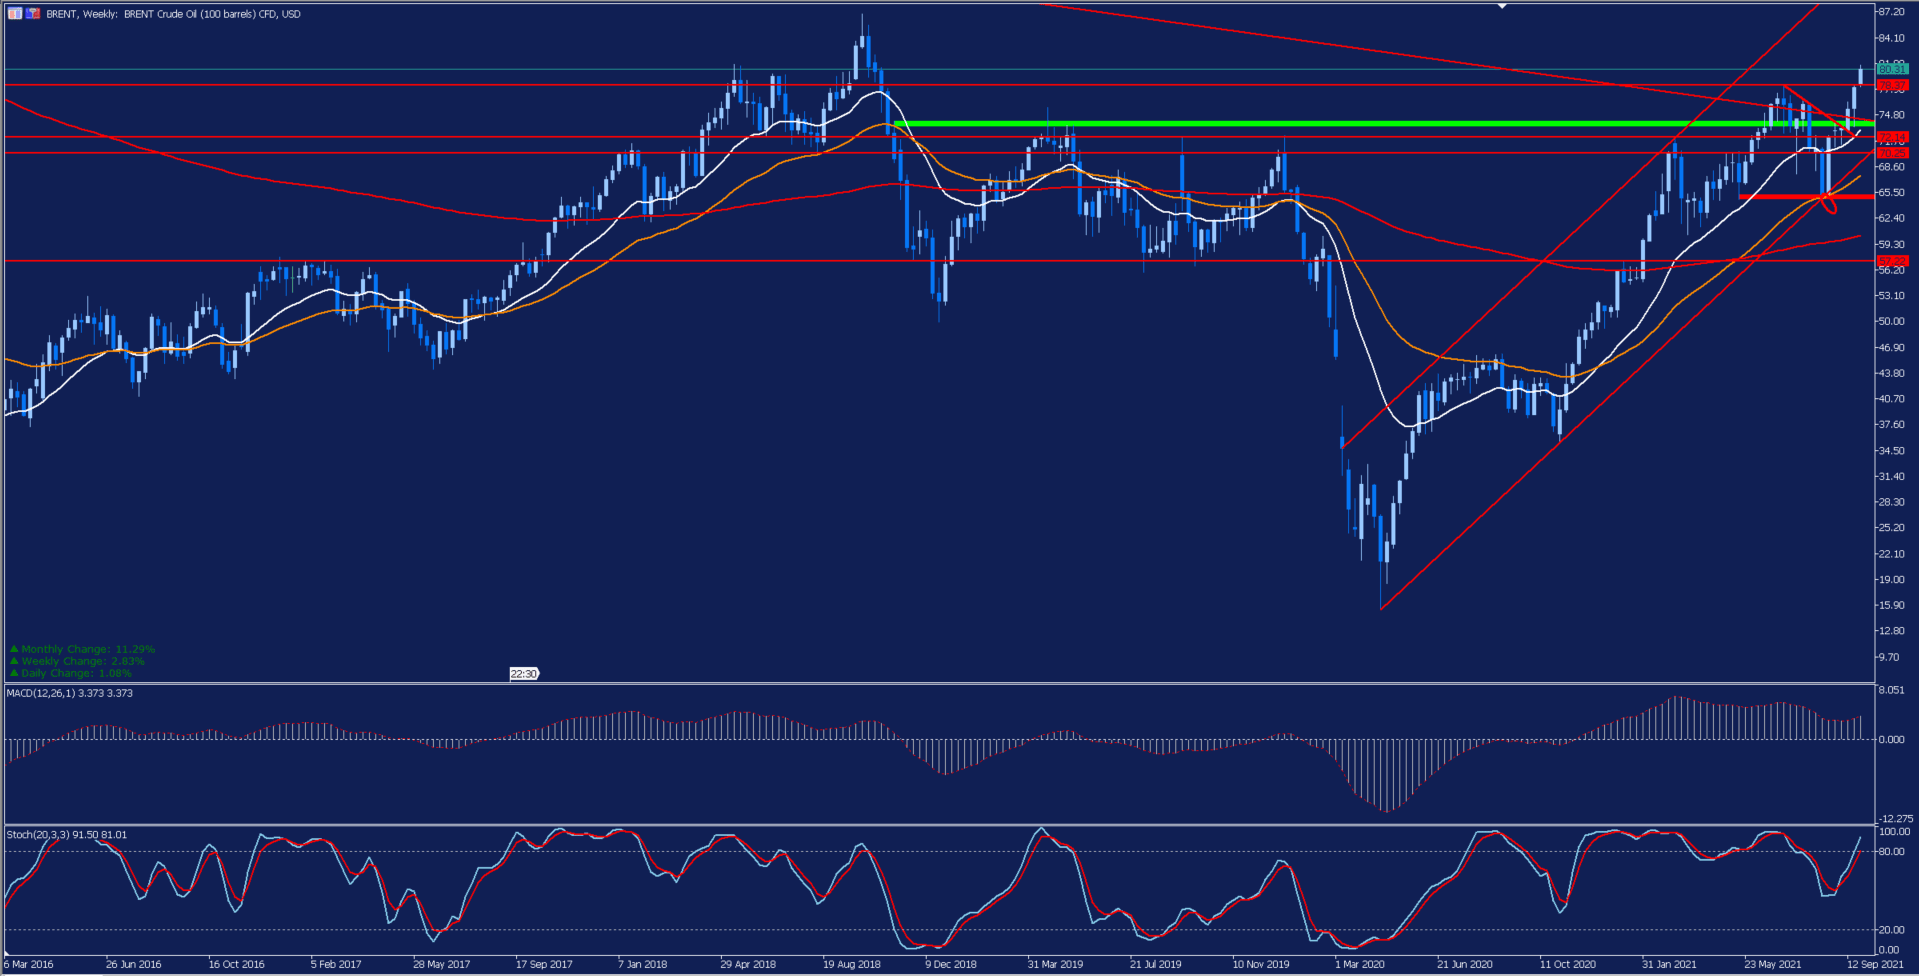
Depicted: Admirals MetaTrader 5 – Brent Weekly Chart. Date Range: 6 March 2016 – 28 September 2021. Date Captured: 28 September 2021. Past performance is not a reliable indicator of future results.
If we focus on the daily chart, we can see that, after bouncing off the coinciding zone of the lower band of the channel and the lows represented by the red band and forming a double bottom, the price has experienced a strong upward momentum that led it to overcome several resistance levels until it surpassed the psychological figure of 80 dollars per barrel.
We can observe that the price is trading very far from its moving averages and with a strong overbought signal in the stochastic indicator. Therefore, we cannot rule out that, in the coming sessions, we may see some consolidation, although for the moment the trend is clearly bullish and the price could continue to climb to 90 dollars as forecasted by Goldman Sachs.
(Click on image to enlarge)
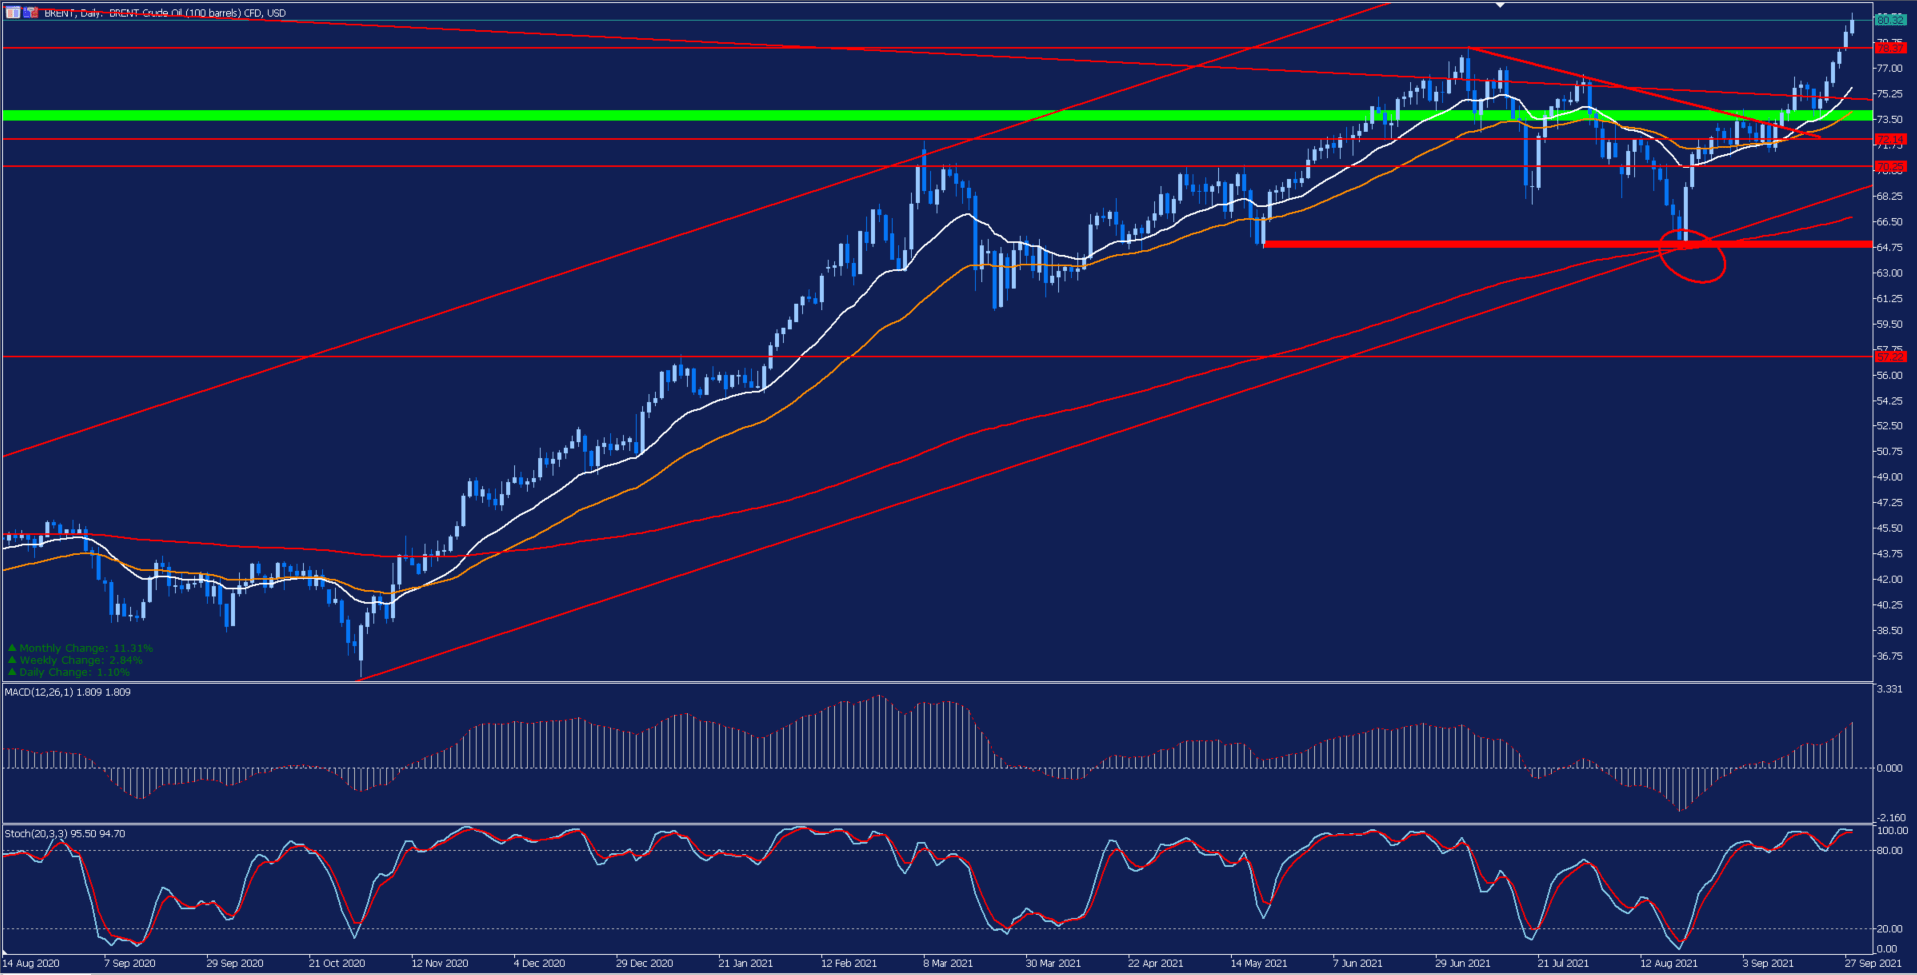
Depicted: Admirals MetaTrader 5 – Brent Daily Chart. Date Range: 14 August 2020 – 28 September 2021. Date Captured: 28 September 2021. Past performance is not a reliable indicator of future results.
Evolution of the last five years:
- 2020: -21.52%
- 2019: 22.68%
- 2018: -19.55%
- 2017: 17.69%
- 2016: 52.41%



Comments
Log in or sign up to join the conversation.