

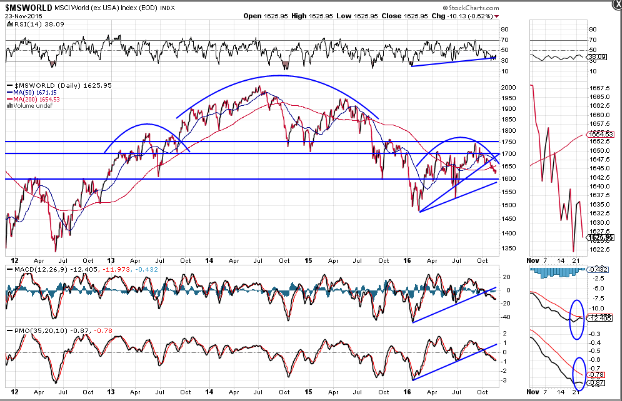
As can be seen on the following Daily chart of the World Market Index, the price has fallen below both the 50 and 200 MAs and is, once again, nearing a critical major support level of 1600.
Even though the price is trading under the bullish influences of a moving average Golden Cross, all three technical indicators are hinting of further weakness to come.
Watch for a bullish crossover of the MACD and PMO indicators, as well as a price reversal and bounce, break, and hold, firstly, above 1700, then above 1750, as a potential signal of clear support of higher prices for world equities, in the longer term, including that of the SPX. Conversely, a break and hold below 1600could very well forecast a large downdraft for all world equities in the near term.
(Click on image to enlarge)



Comments
Log in or sign up to join the conversation.