


“Because people’s views of the future are heavily colored by their recent past, they tend to expect a continuation of whatever trend has been in place… When a major change in the environment occurs, they are invariably caught looking backward.”—Howard Marks
“It’s not what you don’t know that gets you in trouble. It’s what you know for sure that just ain’t so.”—Attributed to Mark Twain
For decades we were told credit was infinite, supply chains that supplied the global economy would be frictionless, and a transition to clean energy would be cheap and effortless—a theory based on wishful thinking rather than raw physics.
That narrative is running directly into a brick wall.
What we are witnessing across global markets isn't a temporary spike in volatility or an unexpected bump in the business cycle. It is the beginning of a multi-year, secular reckoning—a structural energy crisis, escalating geopolitical tensions, and an unsustainable mountain of sovereign debt converging into a classic inflation-fueled trap.
If you want to understand where we are headed, you have to follow the math, the energy, and the debt.
On the day this is being written, the Iran conflict is 188 days in. If tracked from the initial missile and air exchanges in April 2024, we are 2 years and 5 months or 884 days, and if viewed from the outbreak of the wider regional war measured from October 7, 2023, the conflict has been ongoing for 1,060 days. At present, there appears to be no end in sight to the conflict.
The market has taken a sanguine view of what has been the largest disruption in the history of the oil age, several times larger than anything experienced during the volatile 1970s.
The prevailing view is that we have weathered the storm, the conflict will soon end, and things will be back to the way they were before the conflict began. I believe this optimism is misplaced. Inventories are falling and will soon reach critical levels, crack spreads at refineries are the highest on record and much higher energy prices are likely ahead of us.
The view our energy tanks could run dry is shared by oil executives from Neil Chapman, Senior VP at ExxonMobil (XOM), who believes oil prices could spike to $150-$160 a barrel. Mike Wirth, Chairman & CEO at Chevron (CVX), warned that our energy buffers and shock absorbers are steadily being drained, leading to physical shortages that would soon be pressing through to consumer prices.
Others from investment bank JP Morgan to Jeff Currie at Carlyle have been warning that US storage tanks are on track to effectively run dry or hit operational minimums by the end of summer.
The market is ignoring these prescient warnings under the belief there is plenty of oil around and the mistaken view that global oil demand has fallen by 5 million barrels a day. So, the thinking goes, there is still plenty of slack in the oil markets that will normalize energy markets once the conflict has ended.
What is still not grasped by the financial markets is that 1.5 billion barrels of expected supply have been removed from the market and have not been replaced by any significant new supply. Of the 20 to 21 million barrels per day (mbpd) that historically transited the Strait of Hormuz, roughly 6 to 8 mbpd of seaborne oil is currently moving through the waterway, though flows remain volatile and subject to disruption.
Combined with maximum pipeline bypass diversion, total Persian Gulf export flows are averaging ~9.5 to 12.5 mbpd, leaving a net global structural deficit of 8 to 11 mbpd.
As shown in the graphs below, two key US crude stockpiles – the Strategic Petroleum Reserve (SPR) and Cushing – are at record lows.
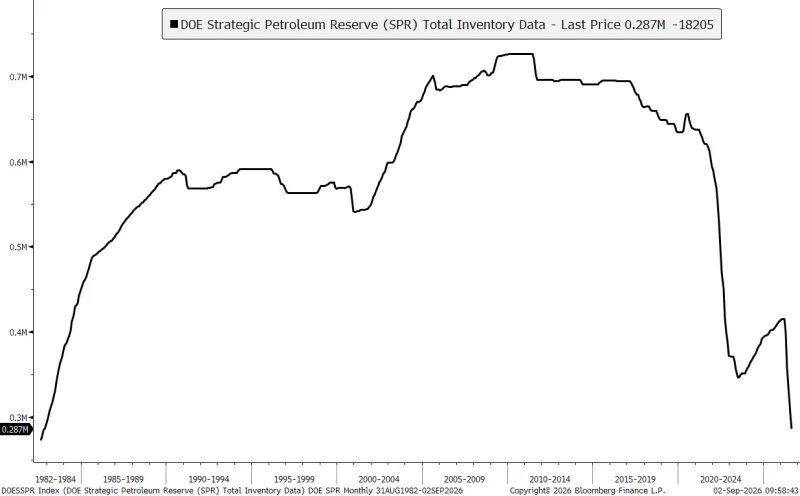
Source: Bloomberg
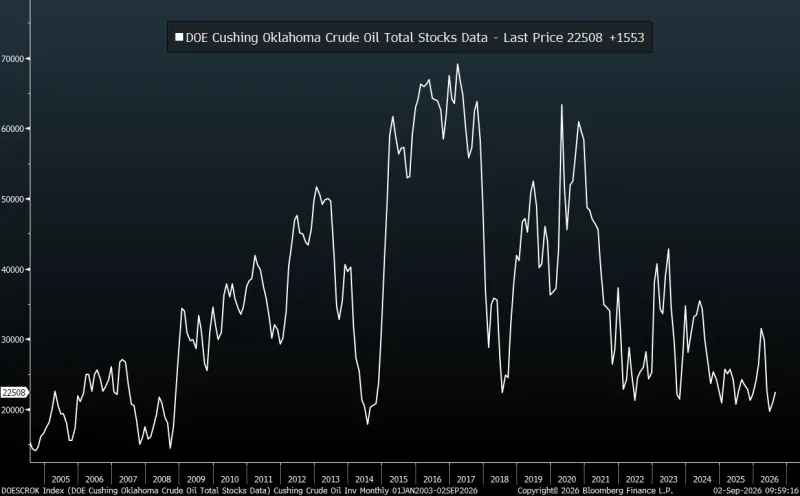
Source: Bloomberg
The EIA estimates total US stocks (commercial + SPR) range between 75-80 days. Refined products are even worse, which is the hidden problem no one is looking at.
Motor Gasoline: 207 million barrels or 22 to 24 days of supply based on average consumption of 9.0–9.2 mbpd.
Distillates (Diesel & Heating Oil): 108 million barrels or 26 to 28 days of supply (13% below the 5-year seasonal average).
Jet Fuel: ~40 to 42 million barrels or 24 to 26 days of supply.
When we think about oil supply, we often focus on crude oil. But consumers don’t use crude oil directly; they use refined products such as gasoline, diesel, and jet fuel. Right now, refineries across the globe have been cutting back on their crude runs due to physical and geopolitical outages as well as structural bottlenecks from wear and tear and maximum utilization, deferred maintenance to high utility and feedstock Input costs. The reasons vary by region, but this story is totally ignored by the markets.
Divergence Between Global Hubs
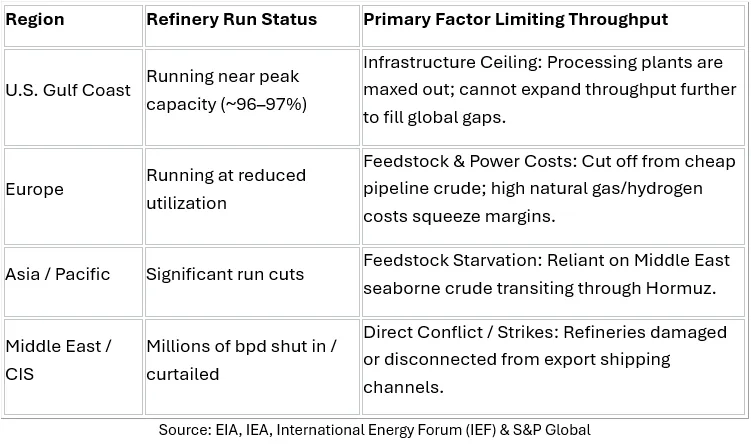
When regional refineries cannot get crude, or when damaged facilities cannot process it, the few surviving refineries (like U.S. Gulf Coast merchant operators) cannot produce enough finished fuel to meet global demand. The resulting acute product shortage is what sends crack spreads to all-time highs, as shown below.
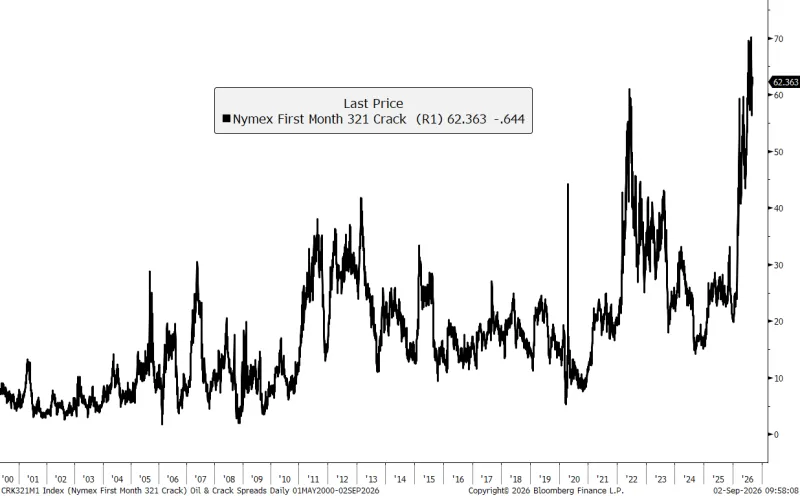
Source: Bloomberg
The recent cuts in refinery crude runs around the world are the hidden story beneath the surface — one I believe will soon reassert itself through higher oil prices. Markets have largely interpreted the decline in refinery runs as evidence of weaker global oil demand. In reality, I believe the cutbacks are being driven more by physical constraints and geopolitical disruptions than by a true collapse in demand.
From the evidence that is easily accessible, demand has strengthened. Despite rising jet fuel prices, commercial flight activity is up 5% year-over-year. Gasoline consumption in the US has risen from 8.85 mbd to 9.35 mbd from early spring to July while diesel fuel consumption rose from 3.65 mbd to 3.85 across the six-month window.
In conclusion, the markets have incorrectly interpreted cuts in refinery runs as a drop in demand vs actual demand which has risen during this period.
This misconception and illusion will give way to higher prices in my view beyond summer into fall and winter and take more than a year before we get anywhere near to normal again if at all.
There is one other factor that has not entered the mainstream of energy thought, which is the more than decade of underinvestment by the energy industry into exploration and development.
The $3.4 Trillion Energy Deficit: A Decade of Underinvestment
The defining macroeconomic reality of the modern commodity landscape is not simply rising geopolitical tensions—it is the cumulative toll of a decade-long investment drought in global upstream oil and gas.
Following the crude price collapse of late 2014, the energy sector underwent a fundamental structural pivot. Upstream capital expenditure (capex) peaked at $780 billion in 2014 and then collapsed into the 2020 pandemic trough. Even with the modest nominal recovery in recent years, upstream spending remains anchored near $595 billion annually. When adjusted for severe oilfield service (OFS) inflation—higher rig rates, steel casing costs, and labor—real physical work completed today remains roughly 40% to 45% below 2014 levels. The cumulative underinvestment over that time is estimated at $3.4 trillion.
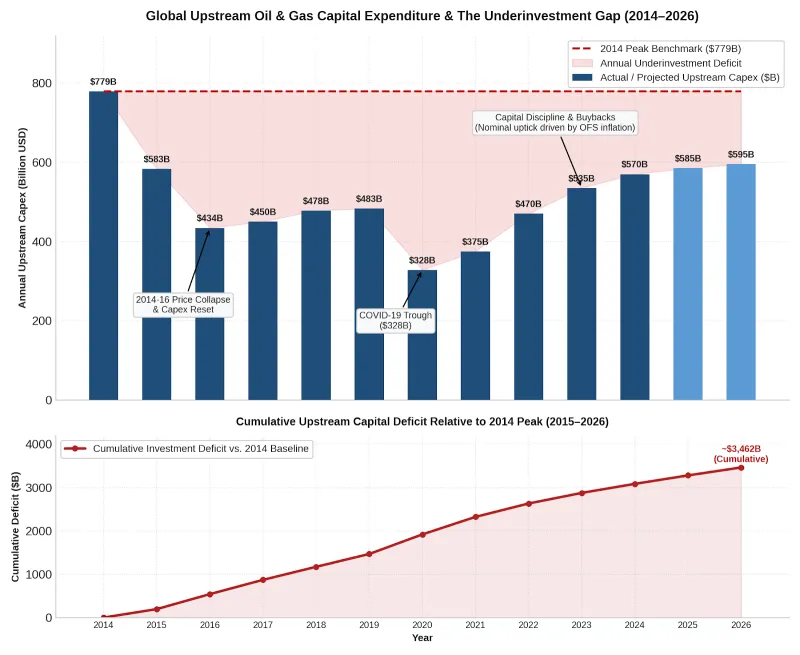
Sources: IEA World Energy Investment, IEF, GECF/Rystad Energy, EPRINC, EIA/Evaluate Energy. Rounded public-source estimates. Note: Underinvestment is the annual shortfall vs. 2014 upstream capex of ~US$780B. 2025–2026 are estimates.
Several factors contributed to this underinvestment: Wall Street’s mandate for capital discipline, ESG pressures and policy disincentives, and the industry’s shift away from long-cycle mega-projects — which can take 5 to 10 years to develop — toward short-cycle unconventional shale, which offers faster production responses.
The physical realities of this underinvestment are unrelenting as global oil fields deplete at an annual rate of 5%-7% without ongoing investment. Because long-cycle projects require multi-year lead times, capital withheld over the past decade creates irreversible structural deficits that cannot be solved quickly with price signals alone.
The result is depleted global spare capacity with spare production concentrated into a handful of core Middle Eastern producers. Non-OPEC conventional discovery rates are at multi-decade lows. This will, in effect, put a structural floor under commodity prices. While short-term demand fluctuations cause cyclical volatility, the marginal cost of adding new barrels has structurally shifted higher.
When an active conflict with Iran concludes and normal navigation resumes through the Persian Gulf and the Strait of Hormuz, the global energy complex will pivot from crisis mitigation to an aggressive restocking cycle. Refineries across Asia, Europe, and North America that ran down commercial inventories and reduced throughput during supply disruptions will rush to secure baseline crude feedstocks. This sudden surge in commercial procurement will operate alongside an urgent need to replenish depleted downstream refined product inventories—primarily diesel, jet fuel, and gasoline—which bore the brunt of wartime shortfalls. The result will be elevated refinery run rates, robust crack spreads, and fierce competition for prompt crude barrels.
Simultaneously, logistics and sovereign balance sheets will absorb the secondary shockwave of normalization. Global tanker fleets—previously disrupted by prohibitive war-risk insurance, detours around the Cape of Good Hope, and convoy operations—will reposition to clear backlogged Middle Eastern export terminals and absorb millions of barrels of floating and in-transit volume. Compounding this commercial demand, governments across the OECD and the International Energy Agency (IEA) will embark on a multi-year campaign to rebuild Strategic Petroleum Reserves (SPRs) that were drained to historical lows during emergency releases. This dual sovereign and commercial restocking wave will establish a structural demand floor for crude oil and shipping rates, keeping physical petroleum balances tight well after hostilities have ceased.
Since energy is a foundational input for economic growth — from transportation and industrial manufacturing to agriculture, metals smelting, and chemicals — a structurally tight energy market can create persistent cost-push inflation across global supply chains. That, in turn, keeps upward pressure on bond yields and sovereign borrowing costs.
The past decade demonstrated that capital can be redirected by policy and market sentiment, but physical depletion continues unabated. The bill for ten years of underinvestment is now coming due in the form of tighter balances, higher baseline volatility, and persistent structural inflation across the real economy.
If the crisis in energy were happening in a vacuum, the financial system might eventually absorb the shock. But it isn’t. While the physical economy is running headfirst into the hard limits of geology and underinvestment, the paper economy is colliding with the compounding laws of arithmetic. You see, an energy shock doesn’t just raise the price at the pump—it acts as a regressive tax on everything that moves, consumes electricity, or requires raw materials, pouring high-octane fuel on the fires of persistent inflation. And that brings us to the second half of this perfect storm: the government’s balance sheet. For decades, Washington spent like a drunken sailor under the delusion that interest rates would stay pinned to the floor forever and that the Treasury could print and borrow ad infinitum without consequence. That free-money party is over. With inflation structurally sticky and trillions in sovereign debt coming due, the bill has arrived—and the bond market is about to enforce the discipline that politicians refused to show.
The Looming Sovereign Debt Reckoning and the Return of Bond Vigilantes
The global financial system is confronting a structural inflection point: the era of zero-cost government borrowing has collapsed into an unsustainable sovereign debt spiral. With gross U.S. national debt breaching the $40 trillion mark and annual federal deficits entrenched near $2.0 trillion (around 6% of GDP)—levels historically unseen outside of wartime mobilization or severe economic downturns—the bond market is re-pricing sovereign credit risk.
For decades, policymakers treated U.S. Treasuries as an infinite balance sheet buffer. Today, the bond market is demanding higher real yields and expanding term premiums, setting off a feedback loop that threatens broader economic stability.
When sovereign debt was expanding during an era of quantitative easing and near-zero interest rates, the compounding effect of deficits was largely masked. That dynamic has now broken down.
Today, accumulated debt and large ongoing deficits are forcing the Treasury to issue unprecedented volumes of short-term T-bills and long-term bonds — not only to fund current government spending, but also to roll over trillions of dollars of debt that was issued during the prior low-rate regime.
Much of that maturing debt was issued at an average interest rate of roughly 1.5%, and is now being refinanced at rates ranging from about 4.5% to more than 5.25%. This is one reason why annual interest expense on the federal debt has risen above $1 trillion — now exceeding annual defense spending.
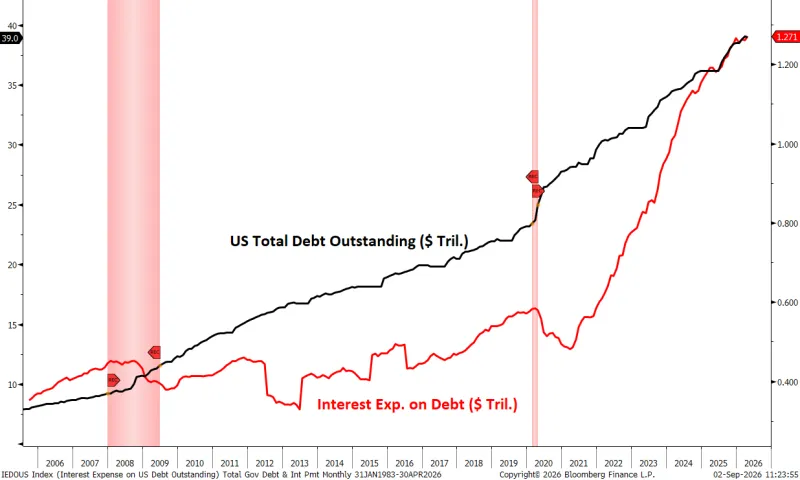
Source: Bloomberg
One reason interest rate are rising besides the Fed’s hawkish inflation views is that private investors now demand a structural risk premium to hold long-duration sovereign paper against sticky inflation risks and heavy debt supply. This is pushing yields on 10-year and 30-year paper higher regardless of short-term central bank policy cuts.
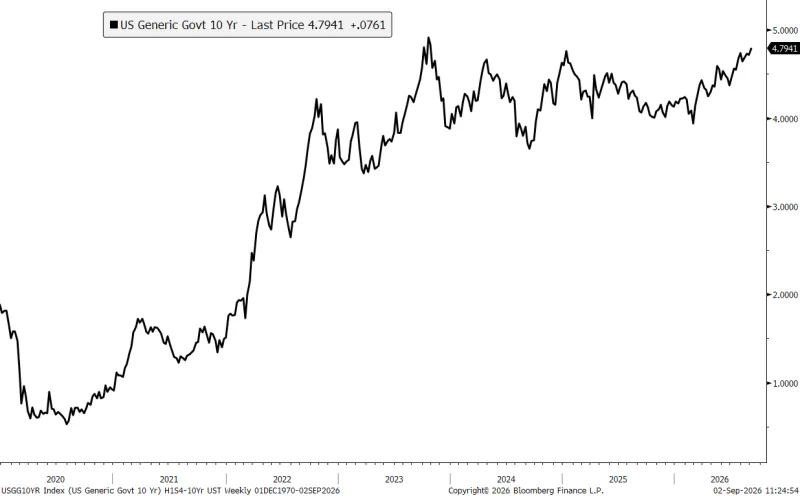
Source: Bloomberg
All of this is leading to fiscal dominance as debt servicing costs consume a larger share of tax revenue, exerting pressure on the Fed’s objectives. This can be seen in Treasury Secretary Bessent’s recent incursions into the bond market in addition to the Fed’s monthly QE of $40 billion a month or half a trillion a year to keep rates lower than where they would be. When sovereign obligations exceed a nation's ability to raise real revenue through taxes or genuine productivity growth, history demonstrates that governments resolve the gap via inflation and currency depreciation. This is what the gold market is telling us along with the decline of the dollar.
The Reality of Physics, Math Always Prevails
When you strip away Wall Street’s cheerleading, government statistics, and academic economic models, you are left with two unyielding laws that govern our economic future: the laws of physics and the laws of arithmetic.
You cannot drill for oil with financial engineering or power an industrial economy on press releases and good intentions. A decade of capital starvation in upstream energy has collided with a widening geopolitical war in the Persian Gulf. Commercial stockpiles are draining toward the physical bottom of the tanks, and the world's refining complex is maxed out. At the exact same time, Western governments have run up a debt tab so massive that the interest payments alone exceed the budget of the world’s most powerful military.
The financial markets have spent years operating under the illusion that debt doesn't matter, energy transitions are free, and central banks can permanently paper over structural deficits. That era is over. The bond vigilantes are waking up, term premiums are returning, and fiat currencies are losing their purchasing power against physical, tangible assets.
When everyone on Wall Street is leaning to one side of the boat—clinging to the comfort of passive index funds and paper promises—experience tells me it’s time to move to the other side.
I believe we are in the early to middle innings of a secular commodity supercycle in an era of persistent fiscal dominance. Navigating this landscape requires discipline, real assets, and an understanding of physical scarcity.
Protect your purchasing power, keep your duration short, and stay anchored in real things.



Comments
Log in or sign up to join the conversation.