

Growth prospects decelerate, while the CPI level looks higher, according to the August Survey of Professional Forecasters.
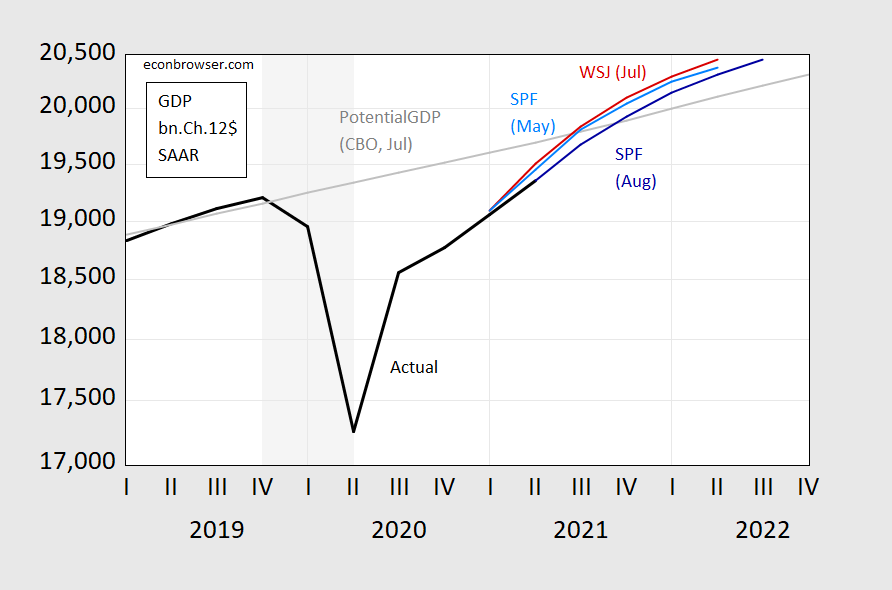
Figure 1: GDP as reported (bold black), forecasted GDP from WSJ July survey (red), forecasted GDP from May SPF (light blue), forecasted GDP from August SPF (dark blue), all in billions Ch.2012$, SAAR. Source: BEA, 2021Q2 advance release, WSJ July survey, Philadelphia Fed Survey of Professional Forecasters (various), NBER and author’s calculations.
The downshift in forecasted growth from May to August is quite substantial. While we don’t have a July SPF forecast, from my experience the SPF and WSJ forecasts for growth are similar. That in turn implies that the perceived growth outlook has dimmed over the past month. Retail sales
Interestingly, the current SPF consensus is closer to the Administration’s forecast locked down in February, than the CBO’s projection published in July. That means — if the CBO’s estimate of potential GDP is accurate.
As expected, CPI inflation is temporarily higher, so that the level is forecasted to be higher.
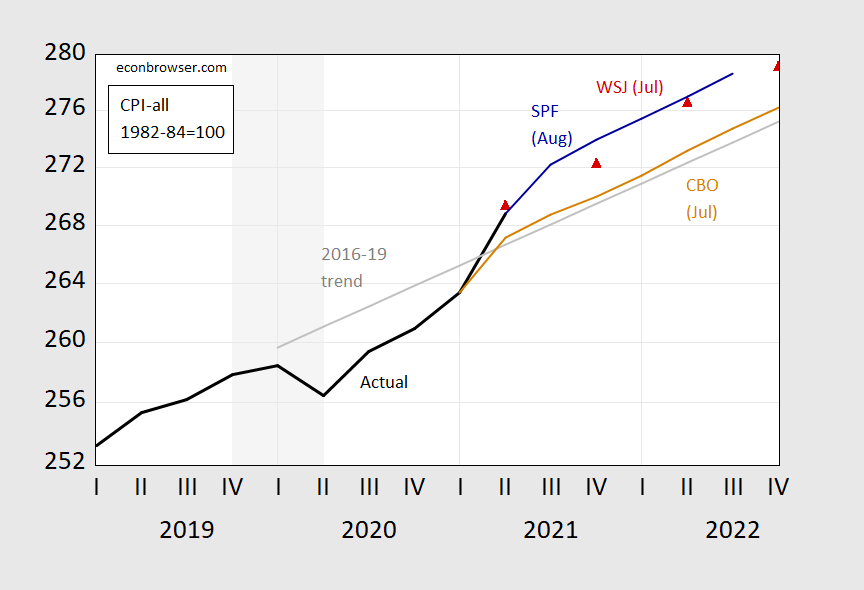
Figure 2: CPI (bold black), CPI projected by CBO (brown), forecasted by WSJ July survey (red triangle), forecasted by SPF (blue), 2016-19 stochastic trend (gray), all1982-84=100. NBER defined recession dates shaded gray. Source: WSJ July survey, Philadelphia Fed Survey of Professional Forecasters, NBER and author’s calculations.
The fact that the forecasted path of prices is roughly parallel to the CBO’s July projection indicates that the jump in inflation is perceived as transitory – the current quarter inflation forecast was raised from 2.6% to 5.2% annualized.
The downshifting of growth expectations is consistent with the fall in consumer sentiment, as measured by the University of Michigan’s survey.
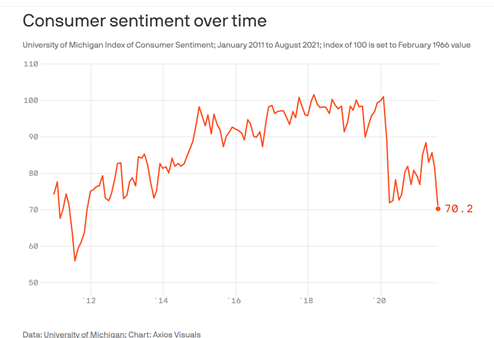
Source: Ro, Axios, August 16, 2021.
The retail sales numbers today, below expectations, suggests an actual cooling of economic activity.
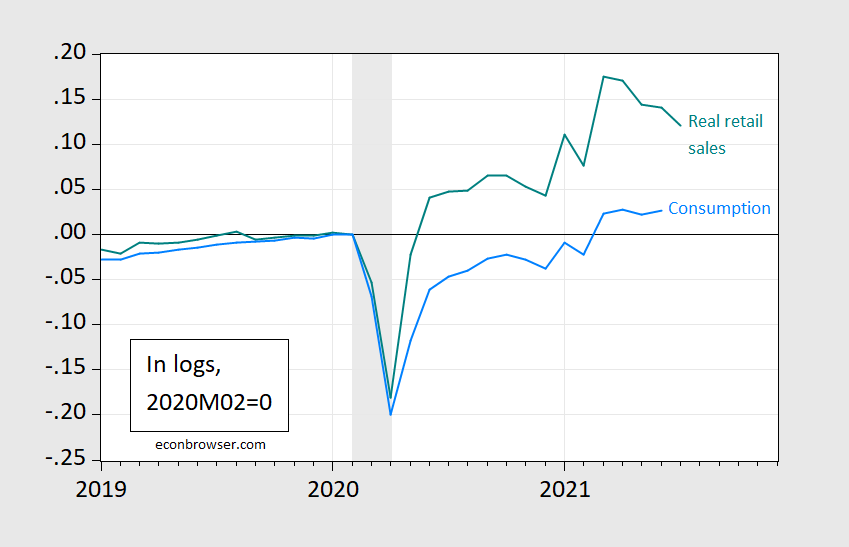
Figure 3: Real retail sales ex-food services, in 1982-84$ (green), and real consumption, in 2012$ (light blue), both in logs 2020M02=0. NBER recession dates shaded gray. Source: Census, BLS, BEA, NBER and author’s calculations.
Previous months’ data were upwardly revised, so IHS Markit nowcast for instance raised estimates of Q2 growth. GS hasn’t released (at least I haven’t seen it) updated nowcasts reflecting retail sales in Q3. For me, it’s of note that real (deflated by CPI) foodservice sales (calculated by substracting retail sales from retail sales and food services) is essentially flat over the last two months.



Comments
Log in or sign up to join the conversation.