

The Survey of Professional Forecasters’ Q3 forecast came out today, the Wall Street Journal August survey yesterday, and the IGM/Fivethirtyeight Covid-19 panel a few days ago. Here’s an opportunity to compare and contrast perspectives – as shown in Figure 1.
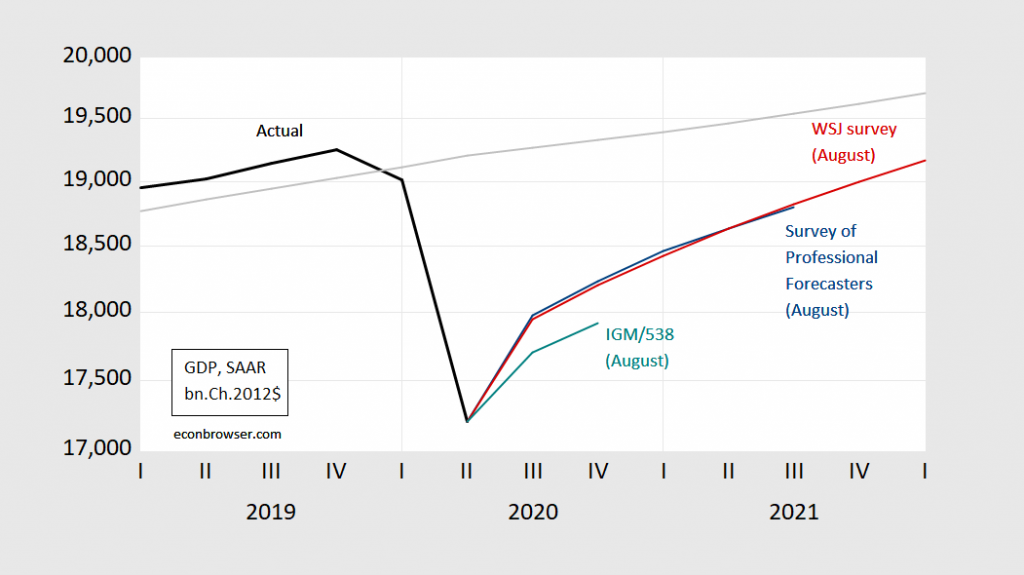
Figure 1: GDP actual (black bold), WSJ August survey mean (red), Survey of Professional Forecasters Q3 survey mean (blue), and IGM/Fivethirtyeight Round 6 survey median (teal). Source: BEA 2020Q2 advance, WSJ survey, Survey of Professional Forecasters, IGM/Fivethirtyeight Round 6 survey, and author’s calculations.
Both the Wall Street Journal and Survey of Professional Forecasters panels are dominated by Wall Street economists defined broadly as bank and consulting firm economists. The IGM/Fivethirtyeight panel is composed entirely of academics (including myself and Jim Hamilton). Interestingly, the IGM/Fivethirtyeight consensus forecast (based on medians, so not strictly comparable to the WSJ and SPF based on means) is noticeably lower than the other two forecasts through 2020Q4. The modal forecast from IGM/Fivethirtyeight is consistent with the level of output in 2022H1 as from the mean forecast from the WSJ and IGM/Fivethirtyeight surveys.
Update, 8/15: macroduck asks for uncertainty of forecasts. The data from the surveys don’t include direct measures of uncertainty, but we can measure dispersion of individual forecasts from the SPF. Using the 75th-25th percentiles for growth in the next quarter (so the Q3 observation is for Q4 growth, SAAR), one finds the dispersion was historically high in Q2 for Q3 growth.
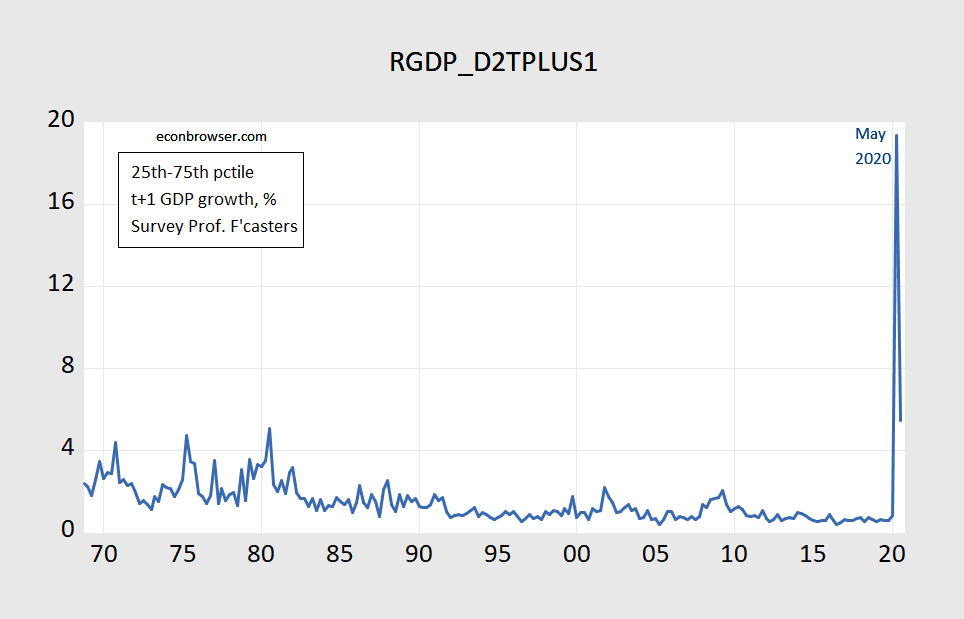
Figure 2: 75th-25th percentile gap, %, for real GDP growth in period t+1 (blue). Source: Survey of Professional Forecasters.



Comments
Log in or sign up to join the conversation.