

Good Monday morning and welcome back. It’s a new week, so let’s start things off with an objective review of my key market models/indicators and see where we stand. To review, the primary goal of this exercise is to try and remove any subjective notions about what “should” be happening in the market in an attempt to stay in line with what “is” happening in the markets. So, let’s get started.
NEW THIS WEEK:
Over time, we have received numerous requests for suggestions on how readers might utilize the indicators/models shown in this report, this week we introduce a “model of models” approach to determining longer-term exposure to market risk. Please note that this is merely an example of how these indicators can be used and is not a recommendation or the positioning of any specific investing strategy. The idea is to illustrate how a disciplined approach may help one stay in tune with the “message” of the models/indicators.
In addition, we’ve included a brief summary of the indicators/models used in the report.
It is our sincere hope that you find the upgrades to our weekly summary of interest.
The State of the Trend
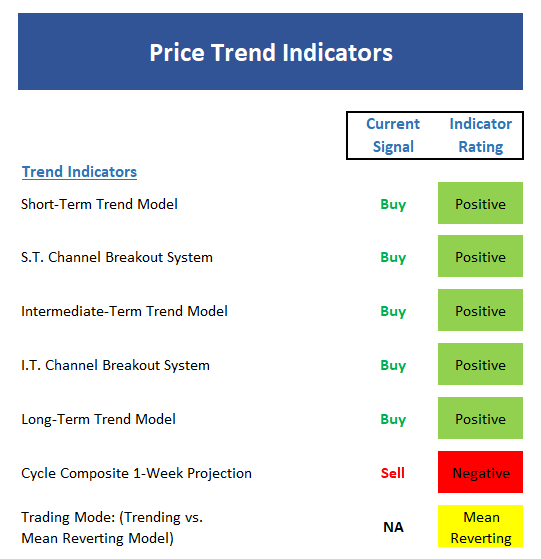
We start our review each week with a look at the “state of the trend.” These indicators are designed to give us a feel for the overall health of the current short- and intermediate-term trend models.
Executive Summary:
- Last week’s rally and fresh all-time highs has turned the short-term Trend Model positive.
- Both the short- and intermediate-term Channel Breakout System remain on their 8/22 Buy Signals.
- The new all-time closing high keeps the intermediate-term Trend Model positive.
- The long-term Trend Model continues positive as well…
- The market action continues to run counter to the Cycle Composite projection, which remains negative next week.
- The Trading Mode models remain unimpressed by the new highs so far and call this a mean-reverting environment.
- The bottom line is the most bullish thing a marke can do is make new highs, so…
The State of Internal Momentum
Next up are the momentum indicators, which are designed to tell us whether there is any “oomph” behind the current trend…

Executive Summary:
- The short-term Trend and Breadth Confirm Model flipped back to positive last week.
- Our intermediate-term Trend and Breadth Confirm Model is also positive – a good thing.
- The Industry Health Model moved up to the moderately positive zone. And with the global version positive, the bulls hold the edge here.
- The negative reading of the short-term Volume Relationship remains a warning sign. But, in and of itself, is not a reason to be negative. This is simply a yellow flag.
- The intermediate-term Volume Relationship is improving but is not yet outright positive.
- The Price Thrust Indicator moved back to positive last week – another plus for the bulls.
- The Volume Thrust Indicator remains neutral. However, note that stock market returns have been above trend when in this mode.
- The Breadth Thrust Indicator is also positive.
- The bottom line is momentum, while not wildly robust here, is positive and moving in the right direction.
The State of the “Trade”
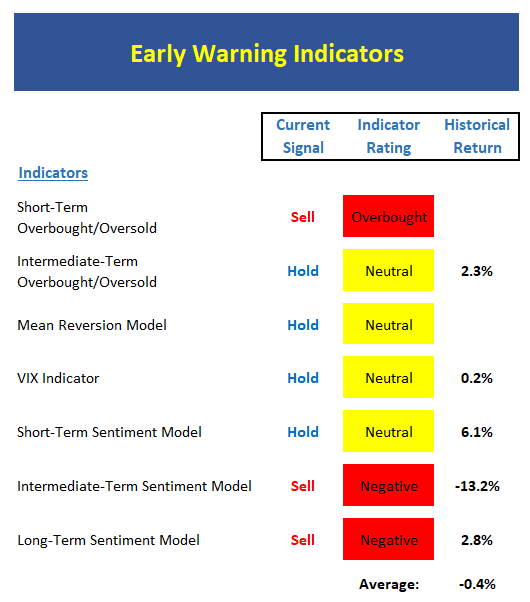
We also focus each week on the “early warning” board, which is designed to indicate when traders may start to “go the other way” — for a trade.
Executive Summary:
- From a near-term perspective, stocks are now very overbought. This alone is not a reason to sell, but it is a warning flag.
- From an intermediate-term view, stocks are not yet overbought, but are getting close.
- After a timely buy signal, the Mean Reversion Model has moved back to neutral and is actually close to a short-term sell/short signal.
- The VIX Indicator also gave a timely buy signal recently is now very close to a sell signal.
- After a timely buy signal, the short-term market sentiment has moved to neutral.
- The intermediate-term Sentiment Model slipped back into the negative zone.
- Longer-term Sentiment readings are also negative.
- The key takeaway here is the “mean reversion/trading winds” are no longer at the bulls’ back.
The State of the Macro Picture
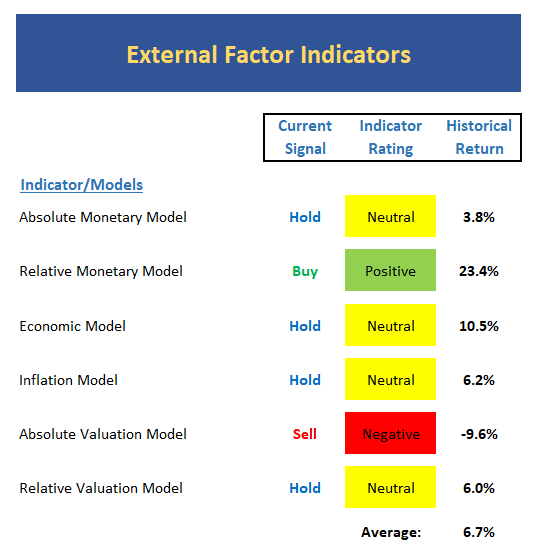
Now let’s move on to the market’s “external factors” – the indicators designed to tell us the state of the big-picture market drivers including monetary conditions, the economy, inflation, and valuations.
Executive Summary:
- Absolute Monetary conditions continue to dip and our 14-indicator model is now falling in the neutral zone.
- The Relative Monetary Model remains in good shape.
- Our Economic Model (designed to call the stock market) continues to falter and is now at the low end of neutral – something to watch.
- The Inflation Model remains solidly neutral. Our inflation models continue to suggest the Fed’s inflation target is unlikely to be sustained.
- The Absolute Valuation Model is still the same – very negative.
- With rates near 2017 lows, our Relative Valuation Model continues to improve and is very close to turning positive.
The State of the Big-Picture Market Models
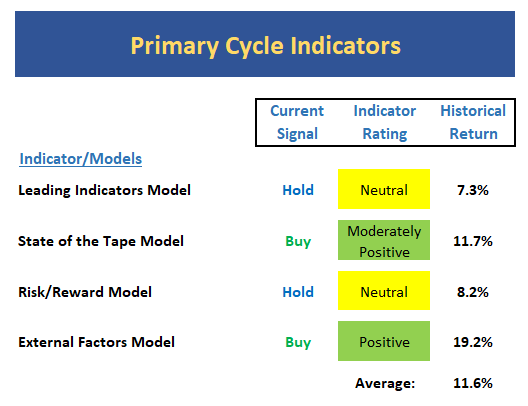
Finally, let’s review our favorite big-picture market models, which are designed to tell us which team is in control of the prevailing major trend.
Executive Summary:
- The Leading Indicators model, which was our best performing timing model during the last cycle,
- The Tape is in decent shape – just not strong.
- The Risk/Reward model is back to neutral.
- The External Factors model continues to improve (likely thanks to the move in rates), which is a good thing from a longer-term perspective.
MY TAKEAWAY…
The readings from the primary cycle board really tell the story here. From a big-picture standpoint, things are in “pretty good” shape, which tells us to continue to give the bulls the benefit of any doubt. However, the facts that (a) the early warning board is waving its flag, (b) momentum is anything but robust, and (c) valuations remain extreme, tells us that risk factors are NOT low at this stage of the game. My take on this is that if the bears were to find a raison d’etre, the ensuing decline could be sharper/more severe than normal. Yet at the same time, stocks have been able to handle just about anything thrown at them this year and so far at least there has been no reason for traders to hit the sell button. So, until/unless there is a reason to worry, the dips are likely to be bought and volatility is likely to remain low.
SAMPLE RISK EXPOSURE SYSTEM
Below is an EXAMPLE of how some of above indicators might be used in order to determine exposure to market risk. The approach used here is a “Model of Models” comprised of 10 independent Models. Each model included gives separate buy and sell signals, which affects a percentage of the model’s overall exposure to the market.
Trend models control a total 40% of our exposure. The 3 Momentum Models and 3 Environment Models each control 10% of the portfolio’s exposure to market risk. The model’s “Exposure to Market Risk” reading (at the bottom of the Model) acts as an EXAMPLE of a longer-term guide to exposure to market risk.
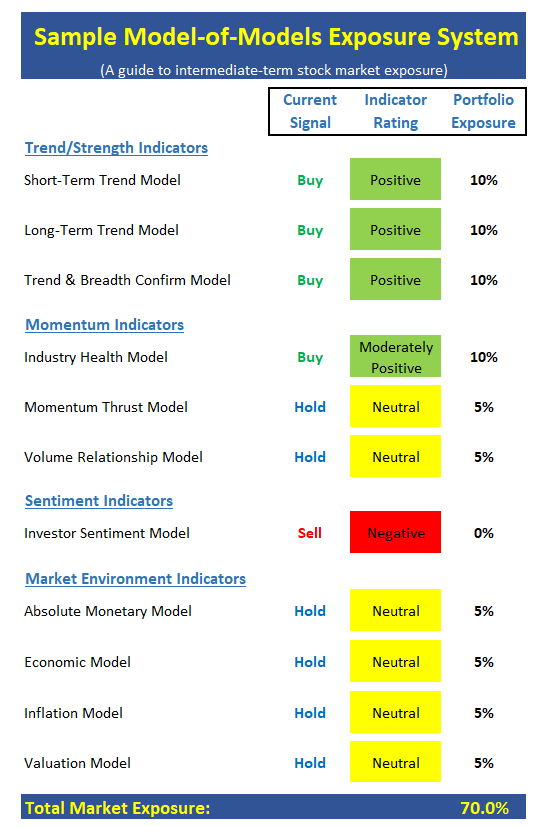
The model above is for illustrative and informational purposes only and does not in any way represent any investment recommendation. The model is merely a sample of how indicators can be grouped to create a guide to market exposure based on the inputs from multiple indicators/models.
THOUGHT FOR THE DAY:
Beware the barrenness of a busy life – Socrates
CURRENT MARKET DRIVERS
We strive to identify the driving forces behind the market action on a daily basis. The thinking is that if we can both identify and understand why stocks are doing what they are doing on a short-term basis; we are not likely to be surprised/blind-sided by a big move. Listed below are what we believe to be the driving forces of the current market (Listed in order of importance).
1. The State of Geopolitics
2. The State of the Economic/Earnings Growth (Fast enough to justify valuations?)
3. The State of the Trump Administration
4. The State of Fed Policy



Comments
Log in or sign up to join the conversation.