


The US midterm elections take place on 3 November 2026, and investors will naturally be watching closely to see how markets respond once the results begin to arrive. But what if investors waiting for Election Day are already too late? Seasonax data going back almost a century reveals an interesting tendency around US midterm elections. Historically, the S&P 500 has often started moving higher before voters even go to the polls.
By using Seasonax’s event analysis, we can examine exactly how the S&P 500 has behaved in the trading days immediately before and after previous US midterm elections. And when we zoom in on those individual trading days, the pattern becomes particularly interesting.
The Six Days Before Election Day
Let’s start by looking below at the period leading into the election. As we look cross 24 historical US midterm elections, we can see that the S&P 500 gained between six trading days before Election Day and the Election Day itself on 18 occasions. That represents a 75% win rate. The average return during this relatively short six-day window was +1.80%, while the median return was even stronger at +2.26%.
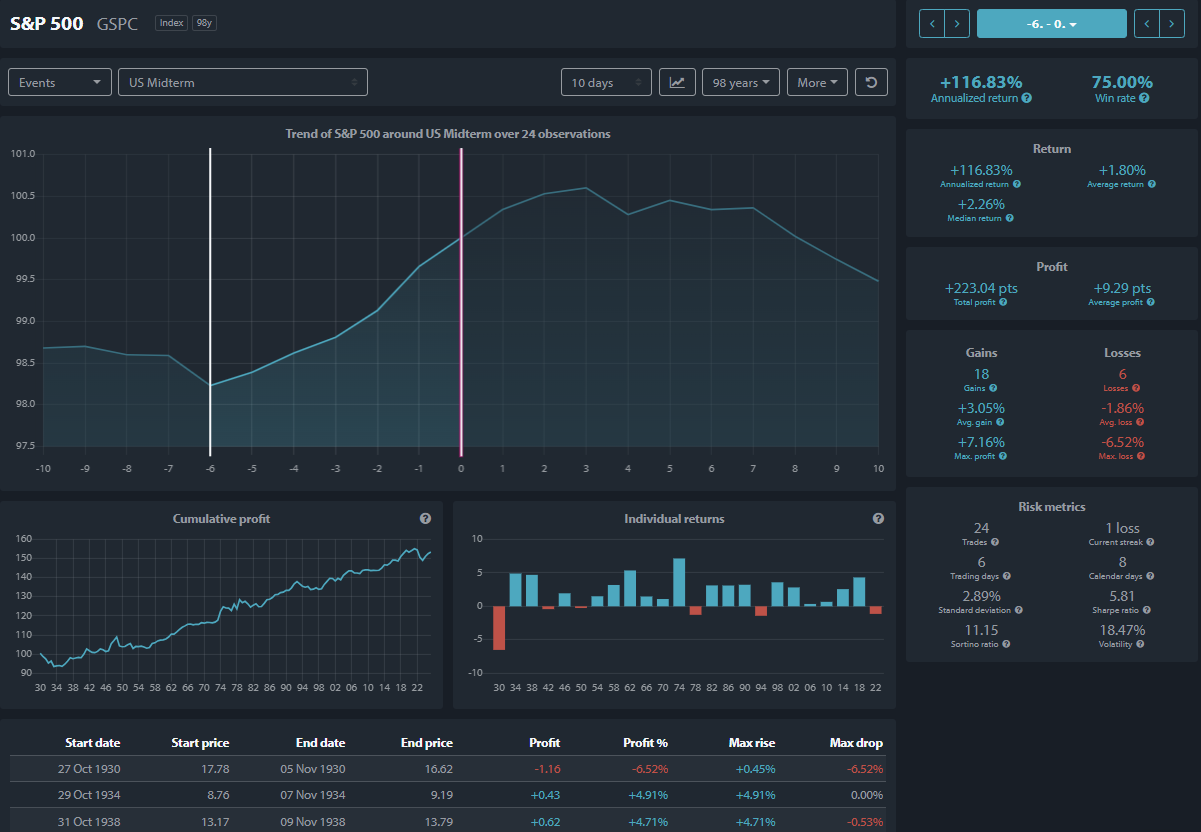
S&P 500, six trading days before US midterm elections to Election Day. Source: Seasonax | View Event Study
The shape of the seasonal pattern is revealing. The S&P 500 reaches a low around six trading days before the election and then historically begins to strengthen. The average pattern rises through the final days of campaigning and reaches Election Day noticeably higher. This is important because investors might instinctively expect the market to wait for the result before making its move. Historically, that has often not been the case.
The more pronounced seasonal tendency has actually started before the result is known.
What Happens If We Hold Beyond Election Day?
We can then extend the study slightly. Rather than finishing the analysis on Election Day, what happens if we examine the period from six trading days before the election until three trading days afterwards? The historical results become even stronger. Across the same 24 observations, the S&P 500 gained on 21 occasions, giving the pattern an impressive 87.50% win rate. The average return increases to +2.41%, while the median return rises to +3.22%.
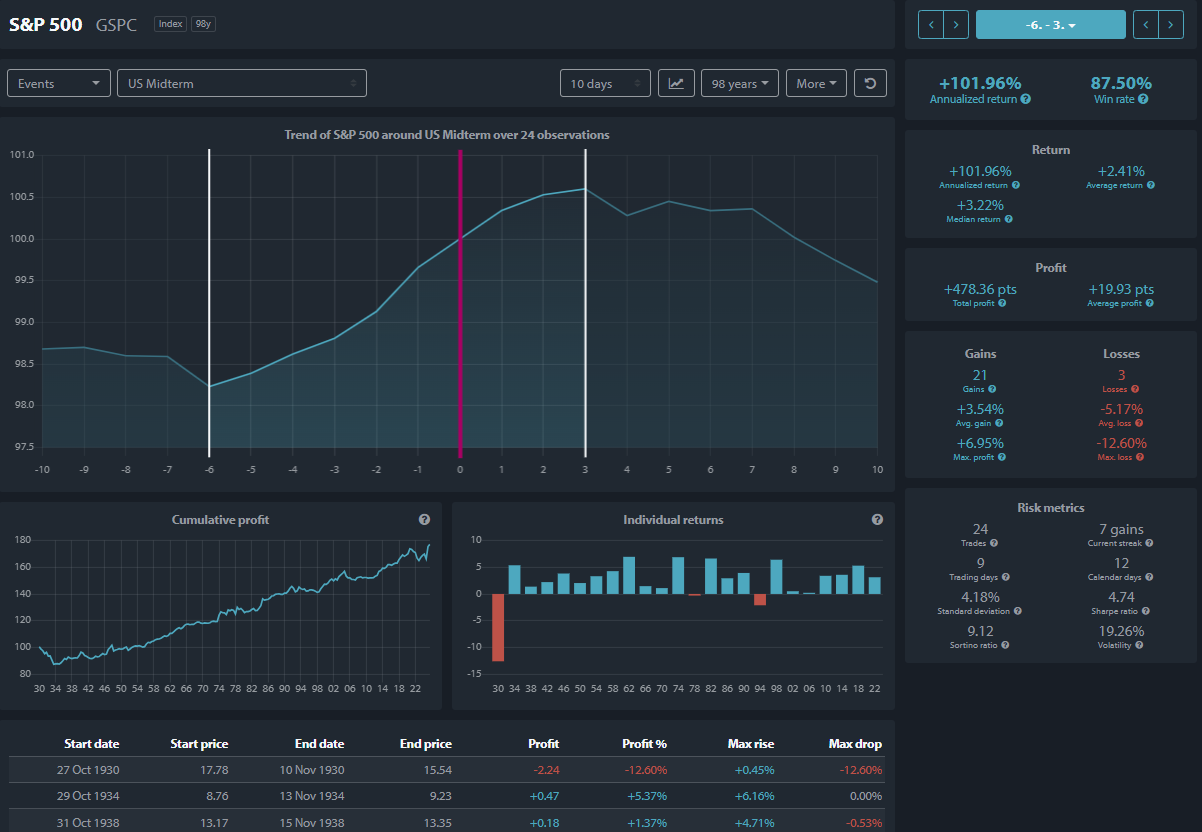
S&P 500, six trading days before US midterm elections to three trading days afterwards. Source: Seasonax | View Event Study
There are two interesting points here. First, extending the period for three trading days beyond Election Day historically improved both the average return and the win rate. Second, look closely at the seasonal curve. The average pattern continues higher immediately after the election, reaching its peak around three trading days afterwards.
So historically, the strongest part of the pattern has not simply been an Election Day reaction. Instead, there has been a tendency for the S&P 500 to strengthen into the election and during the first few trading days that follow.
But What Happens Next?
This is where the Seasonax data becomes particularly useful. If we extend the study further and look at the 10 trading days following the midterm election, the picture changes significantly. Across the 24 historical observations, the S&P 500 gained during just 45.83% of those post-election periods. The average return was actually -0.52%, with a median return of -0.54%.
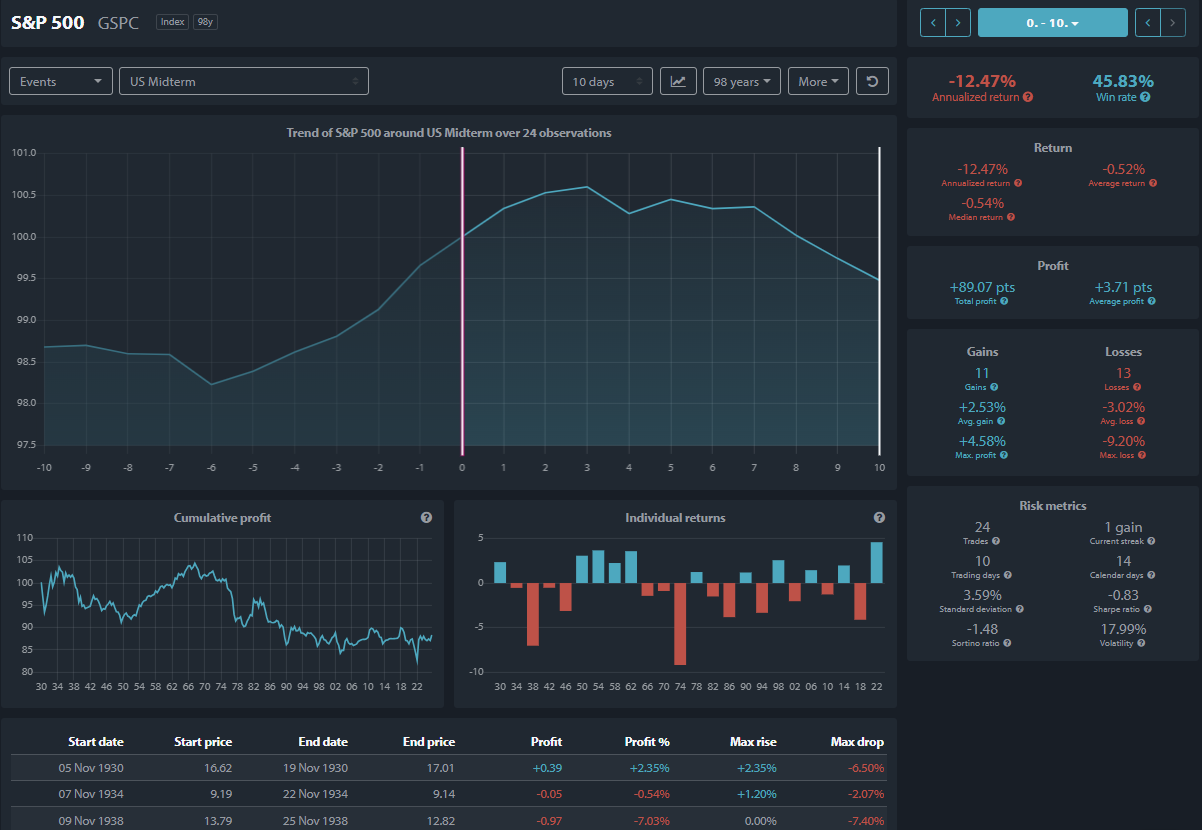
S&P 500, Election Day to 10 trading days afterwards. Source: Seasonax | View Event Study
Notice what happens to the seasonal curve. After reaching a high around three trading days after the election, the average pattern begins to weaken. By the tenth trading day after the election, much of the immediate election-period strength has historically been surrendered. That gives us a much more precise seasonal picture.
The historical tendency has not simply been that midterm elections are positive for stocks. The timing has mattered. The stronger historical window has tended to begin around six trading days before Election Day, continue through the election itself and persist for approximately three trading days afterwards. Beyond that point, the historical tendency becomes much less convincing.
What Does This Mean for 2026?
Of course, none of this tells us how the 2026 election will turn out. Nor does it tell us how investors will react to any particular political outcome. That is not the purpose of the study. What Seasonax allows us to do is separate the political question from the historical market pattern.
Across almost a century of midterm elections, the S&P 500 has shown a surprisingly consistent tendency to strengthen in the days immediately surrounding the vote. However, the most interesting finding is that much of that strength has historically begun before Election Day itself. Whether 2026 follows that historical pattern remains to be seen. But as Election Day approaches, this is certainly one seasonal window worth watching.



Comments
Log in or sign up to join the conversation.