

Part 1 – Market Intel
When it comes to today’s stock market, there are three things investors want to know. They are:
- Is the bull market intact?
- Is a recession on the horizon?
- What else should I be concerned about?
The answer to each is yes, no, and a lot.
Let’s look at each beginning with this reports’ focus – Is the bull market intact?
Methodology
To determine the state of the stock market – most any stock market, for that matter – it is best served if we look at the actual market and not at the economic, financial or business metrics that support a given trend. The reason for this is rather simple: the state of the market is best determined by measuring key metrics that reveal its trend and not at the drivers for said trend.
The aforementioned economic, financial or business metrics that support a given trend are necessary to know but are flawed when trying to determine what trend stocks are in. They are necessary in that stocks are connected to the overall economic environment via their earnings, the level of interest rates and the degree of risk investors are willing to take1 but they are flawed in that (a) they are highly variable due to the subjective nature of the valuation models used1a, (b) stocks have an anticipatory nature and can rise or fall well in advance of the real economy impacts felt and (c) economic and business activities can produce false signals that investors for whatever reason can (and often do) choose to ignore2.
That being said, let’s look directly at the US stock market using the S&P 500 as our index and our main market intelligence (market intel, for short) tool, the Mega-Trend.
Market Intel: The Mega-Trend
To state our conclusion upfront: A bear market requires a market trend change that just does not appear to be in the cards. For this we look at the momentum tool I call the Mega Trend3.
The 24-year history of the Mega Trend shows that there have been 14 signals – 14 trend changes – during which 3 have been bullish, 2 bearish and 9 that went from bullish to bearish and then back (false). Here is the chart showing the 24-year history of the Mega Trend (1994 to the present) with the signals shown in arrows indicated in red (bull to bear), green (bear to bull) and blue (false signal)4.
(Click on image to enlarge)
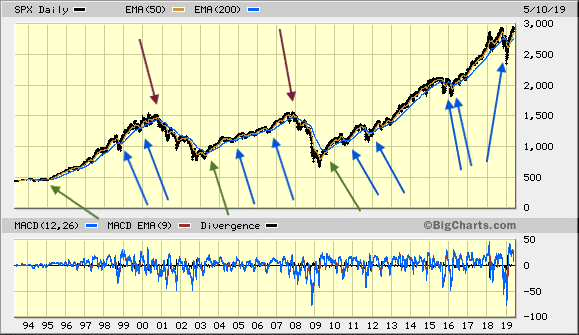
From this chart of the Mega Trend, three things stand out. There have been
- 3 green – bear to bull – signals
- 2 red – bull to bear – signals
- 9 blue – false – signals
The green and red arrows are self-explanatory. Up is up and down is down and they are so for extended periods of time (as in years). So, let’s look at the blue arrows, the false signals generated.
Why Am I So Blue?
When a trend change is signaled, stocks change direction (from bull to bear, conversely from bear to bull). However, when a trend change signal is reversed within a 3-month period, the previous trend in place is reestablished. That is what you see in the above chart. 9 times stocks signal bull to bear, BUT in each of those cases WITHIN A 3 MONTH PERIOD stocks reverted back to its original trend, which in this case was bullish. To reiterate: When the Mega Trend generates a false signal, it provides a safety hatch, if you will, in which that false signal is reversed within 90 days (3 months)5. During that period, the losses produced by the false signal (from bull to bear and back) tend to be small while the gains (or avoidance of losses in a bull to bear call) tend to be quite large.
The Connection to the Real Economy
During this multi-decade period, each blue (false) signal was truncated by the central bank stepping in and providing the necessary liquidity to stem the potential decline in equity prices – that is until circumstances overwhelm the economy and precipitate a recession and a decline in corporate profits. This intervention by the US Fed has come to be known as the Greenspan/Bernanke/Yellen/Powell put6. The monetary cavalry comes to the rescue!
Back to the Mega-Trend
Now if we take our telescope and zoom into a shorter time period, we can take a closer look at the Mega-Trend and see what it reveals.
(Click on image to enlarge)
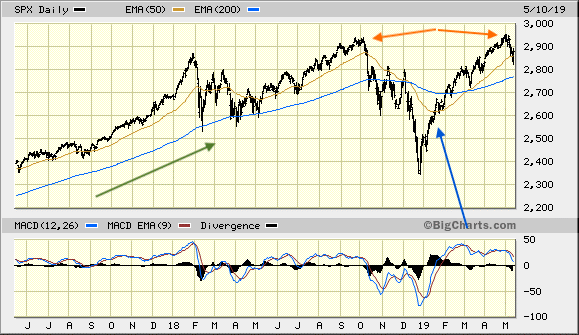
Here we see the established bull (green arrow) in action with price above its moving averages (50 and 200 day), the shorter-term moving average (50 day) above its longer-term brother (200 day), and both moving averages upwardly sloped. You will note that along the bullish way there are times when price might dip below one or even both moving averages and there are times when the slope of the shorter-term 50-day moving average loses its upward slope, but it is only when all three conditions are in place IN THE OPPOSITE DIRECTION that a trend reversal is underway. That occurred in late 2018/early 2019 and a bear signal was triggered. However, as was the case 8 previous times, the reversal signal was negated in the requisite 3-months time and the previous trend (which was bullish) was reestablished.
Pattern Recognition
There are many other market intel tools that are part of the investment decision-making process and they should be reviewed and considered for the message they are sending7. And while they have a far lower predictive value than the Mega-Trend, used in conjunction with the Mega Trend they can help provide insight to the trend at hand. I have included one such tool which I call Pattern Recognition.
One example of a market pattern recognition is the double top. The orange arrows above illustrate that fairly clearly. The requisite time period for a double top is 3 months in which price matches one to the other. According to those who subscribe to such a tool, what follows should be a major market decline.
For our purposes, we have been warned of its existence and will keep that in mind as our primary market intel tool, the Mega-Trend, does its thing.
Investment Strategy Implications
In sum: US large-cap stocks are in a bull trend until they aren’t. Why this is so requires we look at the real economy which will be subject of our next report.
1 These are the inputs into the discounted cash flow (DCF) model, which we will discuss in the next report.
1a Valuation levels can vary significantly as evidenced by many studies, including the Shiller CAPE model. This, too, will be covered in the next report.
2 This will be covered in our third report, which includes investible liquidity.
3 Price in relation to its moving averages (50 and 200 day), the moving averages in relation to each other, and the slope of the moving averages. It is this third element, the slope of the moving averages, that distinguishes the Mega Trend from other market intel tools such as the golden (bullish) and the death (bearish) crosses. The reason the slope is important is that too many false signals are generated without incorporating it into the investment decision.
4 When a false signal is generated, the preceding trend is reestablished.
5 That has been history thus far but that does not guarantee that what happened in the past will happen in the future. History is a guide, not gospel.
6 This is so due to the underlying economic theory: neoliberalism. More on this in the next report.
7 e.g. Investor sentiment, other patterns, other momentum tools.
Stock market charts via BigCharts.marketwatch.com



Comments
Log in or sign up to join the conversation.